Video Marketing
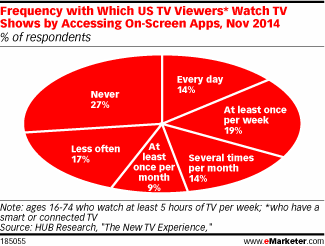
Frequency Of On-Screen TV App Use, November 2014 [CHART]
The installed base of US connected TVs was at 22 million in Q4 2014, up from 13 million in Q4 2013.
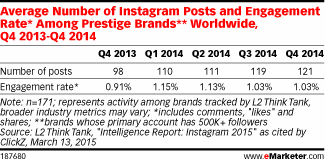
Read MoreFrequency Of Prestige Brand Instagram Posts & Engagement, Q4 2013-Q4 2014 [TABLE]
Instagram presents brands with an audience that’s enthusiastic about engagement.
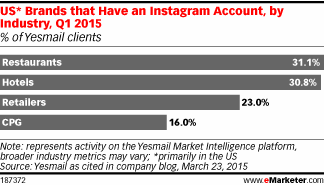
Read MoreBrand Adoption Of Instagram By Industry, Q1 2015 [CHART]
Brand Adoption of Instagram: Just 23% of US brands had an account on Instagram.
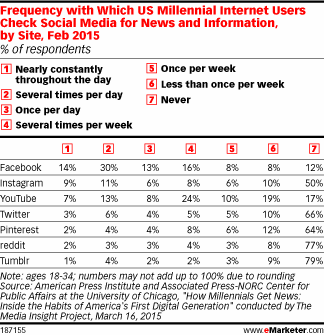
Read MoreFrequency With Which Millennials Check Social For News [TABLE]
57% of US millennials checked Facebook at least once a day to get news and information.
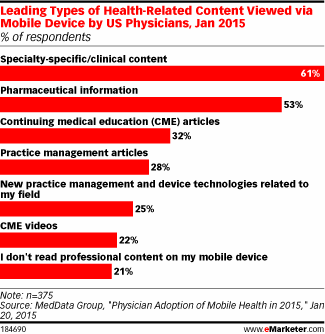
Read MoreTop Mobile Content Consumed By Physicians
Specialty-specific or clinical content was the leading type viewed via mobile by US physicians.
Read MoreState Of The Internet, 2015 [MARY MEEKER PRESENTATION]
Mary Meeker’s annual State of the Internet report was released today and, as usual, it is jam-packed with fascinating and useful stats on how we use online communications.
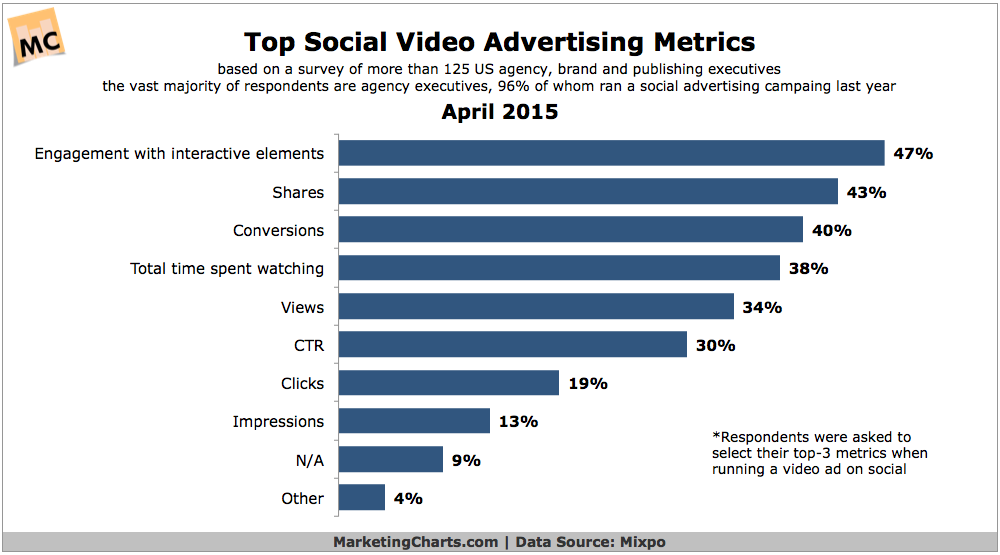
Read MoreSocial Video Advertising Metrics, April 2015 [CHART]
Advertisers running video ads on social media are more interested in metrics such as engagement with interactive elements and shares than they are with views.
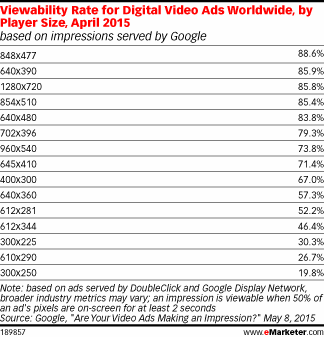
Read MoreViewability Rates By Video Ad Dimensions, April 2015 [TABLE]
According to April 2015 research by Google, shelling out for larger ad sizes could help boost viewability.
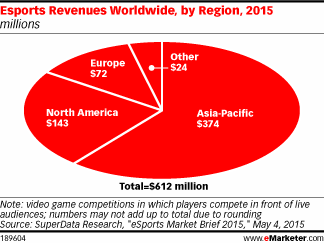
Read MoreGlobal eSports Revenue By Region, 2015 [CHART]
eSports revenues worldwide were forecast to reach $612 million this year.
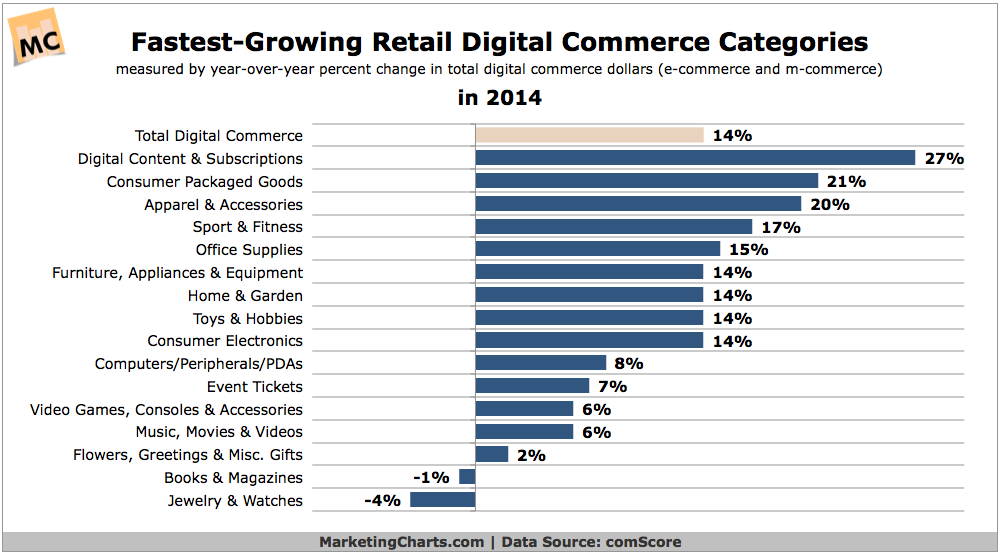
Read MoreFastest-Growing Retail eCommerce Categories, 2014 [CHART]
eCommerce and mobile-commerce spending on digital content and subscriptions increased by 27% year-over-year in 2014, almost doubling the overall retail digital commerce growth rate of 14%.
Read More