Video Marketing
Financial Advisors' Use Of Social Media By Channel
A Q1 2012 survey of US financial professionals found that almost nine in 10 had an account on at least one social media service.
Read MoreTime Spent With TV & Online Video Among The French [CHART]
French viewers increased the share of time spent watching video via TV channel websites, up to 33% in March 2012, from 25% in January.
Read MoreThe Data Minute [INFOGRAPHIC]
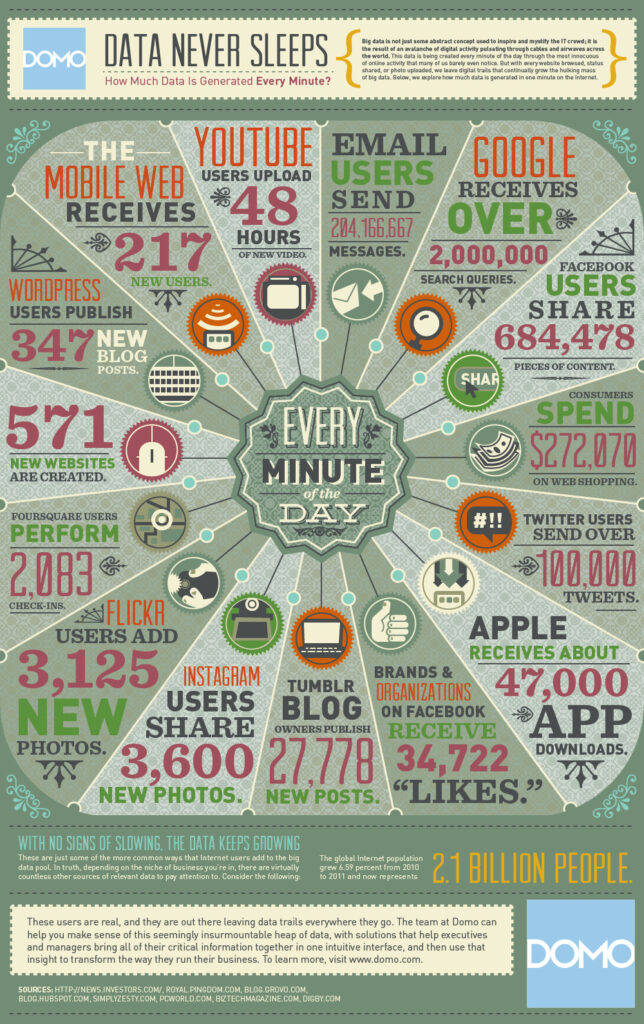
DOMO created this infographic to illustrate how much data is created every minute.
Read MoreSocial Media Personas [INFOGRAPHIC]
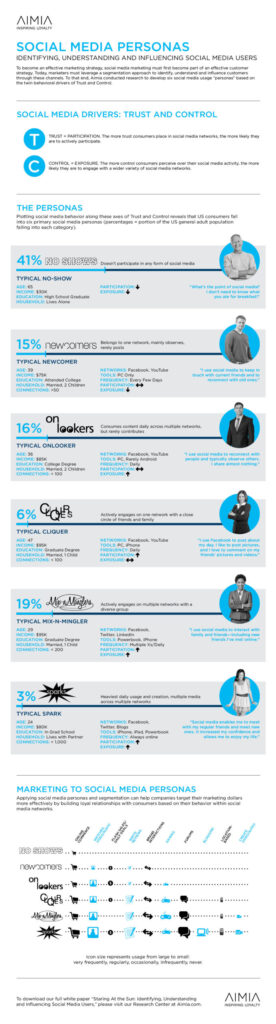
Amia research created this infographic of six different social media personas.
Read MoreAmerican TV & Online Video Viewers By Device [CHART]
Despite the growing use of second- and third-screen devices, TVs remain the dominant way that people get their video fix.
Read MoreDevices Used To Watch TV & Online Video [CHART]
91.7% of consumers have watched video content on another device besides a television.
Read MoreFrequency Of Mobile Video/TV Consumption Among US Smart Phone/Tablet Users [TABLE]
According to an April comScore MobiLens study, 53% of US tablet users watched mobile video or TV at least once that month, compared to only 20% of smartphone users.
Read MoreTop 8 Types Of Videos Tablet Users Favor [CHART]
Short-form news and entertainment videos trumped long-form movies or television shows as the most popular videos watched by tablet users.
Read More