Video Marketing
Video Consumption By Platform & Generation, Q4 2012 [TABLE]
In Q4 2012, seniors averaged 220 hours and 55 minutes per month watching traditional TV.
Read MoreAmerican Seniors' Technographics [CHART]
Although a majority of seniors have mobile phones, comparatively few have smart phones.
Read MoreMost Difficult Social Media Marketing Tactics, February 2013 [TABLE]
The top three most effective social marketing tactics were also the most difficult tactics to execute.
Read MoreMost Effective Social Media Marketing Tactics, February 2013 [TABLE]
To best achieve social objectives, the greatest percentage of B2B & B2C marketers cited creating articles and blog post content.
Read MoreBeyond Social Media: Ford Stung by Agency, Fining Bloggers & HBO Go Unleashed [PODCAST]

This week’s highlights: Ford Stung by Agency; Social Tiger Haters; NRA’s Robocalls; Fining Bloggers; HBO Go Unleashed? Amazon’s Zombies & Reddit’s Five Year Olds & Illustrating Keynotes.
Read MoreAmericans’ Favorite Media Activities By Generation, March 2013 [CHART]

64% of Americans rank watching TV (on any device) as one of their top-3 media activities, down from a high of 71% in 2009 and 2010 but enough to keep TV viewing as America’s favorite media activity.
Read More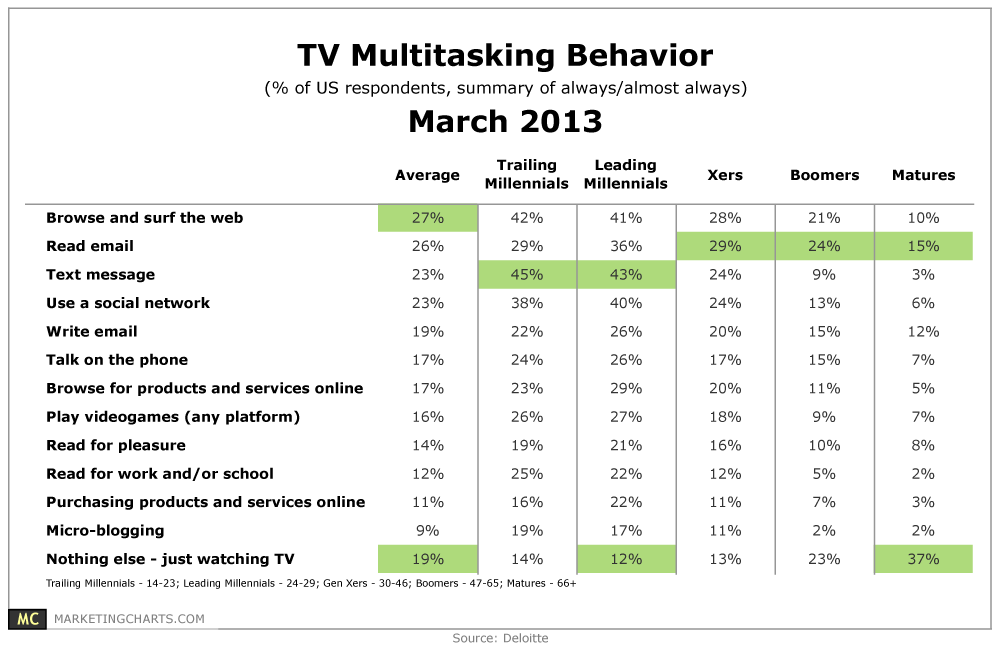
Native Video Ads vs Pre-Roll, March 2013 [CHART]
Native videos drove higher brand lift in each of the 5 campaigns studied compared to pre-roll video ads.
Read MoreMost Popular Television Network Tablet Apps, February 2013 [CHART]
31.7% of tablet owners said they had downloaded a network TV tablet app.
Read MorePay TV Tablet App Use, February 2013 [CHART]
26% of respondents with tablets had downloaded their service provider’s tablet app. But even of those who had downloaded the app, only 18% said they’d used it.
Read More