Video Games
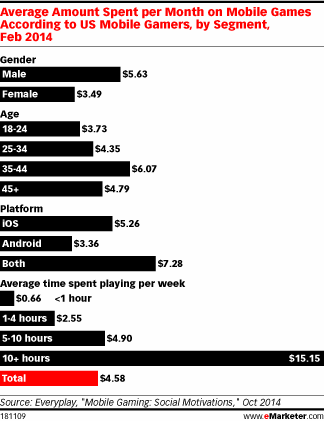
Average Monthly Spending On Mobile Games By Segment, February 2014 [CHART]
The smartphone gaming audience will see faster growth in 2014 and all the way through 2018.
Read MoreGlobal Mobile Gaming Revenues By Device, 2013-2017 [CHART]
Mobile game revenues will rise 42% year over year to hit $25.0 billion in 2014. Next year, the total will come in at $30.3 billion.
Read MoreVideo Gamers By The Numbers [INFOGRAPHIC]
This infographic by GDreamers illustrates some facts and figures about Americans who play video games.
Read MoreMost Popular Streaming Video Devices, August 2014 [CHART]
While the laptop computer is the most common device used by US streaming households, streamers are also using game consoles, Blu-ray or DVD players, Roku boxes, and smart TVs.
Read MoreEffect Of Notifications On Opening An App By Category, July 2014 [CHART]
Mobile apps grab over half of US internet users’ time spent with digital media, and app retention and engagement are up.
Read MoreOnline Platforms For Which People Are Concerned About Privacy, June 2014 [CHART]
Among the US adult internet users polled, 66% said they were concerned about their privacy on social networks such as Facebook—the top response.
Read MoreTime Spent Watching TV/Movies By Generation & Device, December 2013 [CHART]
For the most part, the younger the person, the more likely he or she is to consume video on a mobile device.
Read MoreMobile Behavior By Device Type, March 2014 [TABLE]
Map usage has exploded in the smartphone era, with double-digit gains in users and usage now accounting for billions of minutes of mobile device time each month.
Read MoreTop Influences Over Youths' Clothing Style & Brand Decisions, July 2014 [CHART]
Clothing is one of teens’ top spending categories.
Read MoreDevice Penetration Among US College Students, July 2014 [CHART]
College students (aged 18-34) own an average of 6.8 devices each, steady from last year.
Read More