Video Games
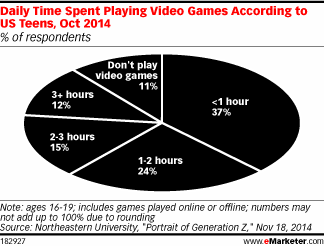
Teens Daily Time Spent Playing Video Games, October 2014 [CHART]
Just 11% of US teens said the do not play video games.
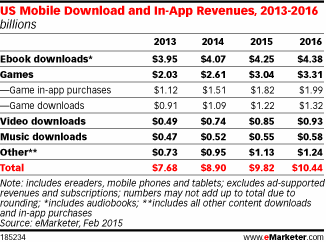
Read MoreMobile Downloads & In-App Revenues, 2013-2016 [TABLE]
Ebook sales will reach $4.25 billion in 2015, accounting for 43.3% of US mobile download and in-app revenues in 2015.
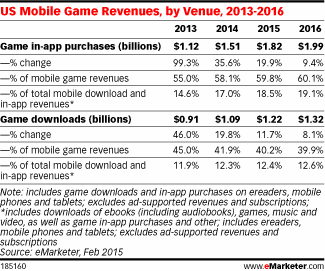
Read MoreMobile Game Revenues By Venue, 2013-2016 [TABLE]
Mobile content revenues in the US will total $9.82 billion in 2015, a 10.3% increase from 2014.
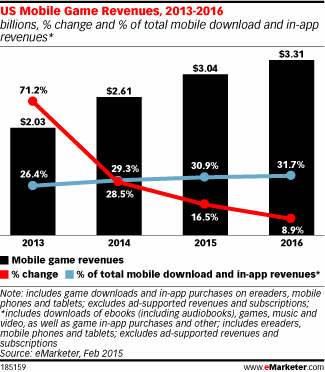
Read MoreMobile Game Revenues, 2013-2016 [CHART]
US mobile game revenues—including both downloads and in-app purchases—will grow 16.5% this year to reach $3.04 billion.
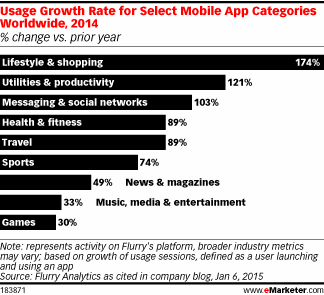
Read MoreGlobal Mobile App Use Growth By Select Categories, 2014 [CHART]
Overall app usage—which involves a user launching and actually using an app—grew by 76% year over year in 2014 .
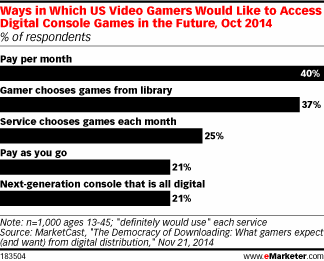
Read MoreHow Gamers Want To Get Their Video Games, October 2014 [CHART]
Video gamers were most interested in a Netflix-style service for digital downloading.
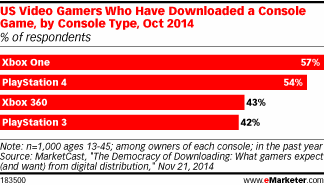
Read MoreGamers Who Have Downloaded A Video Console Game, October 2014 [CHART]
About half of US video gamers who owned an internet-connected console like PlayStation or Xbox had paid for a game via digital download in the past year.
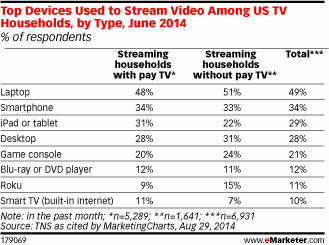
Read MoreTop Devices Used To Stream Video, June 2014 [TABLE]
Laptop computers were the most common device used to stream videos.
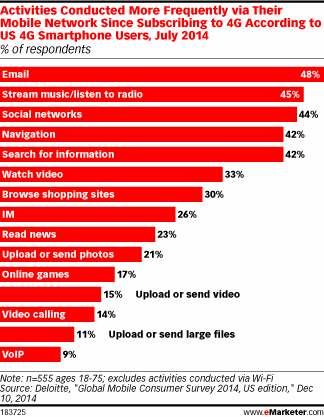
Read MoreIncreased Mobile Activities Due To 4G Adoption, July 2014 [CHART]
When a July 2014 Deloitte study asked subscribers in the US about which activities they conducted more frequently via their mobile networks since signing up for 4G, 33% said they watched more video.
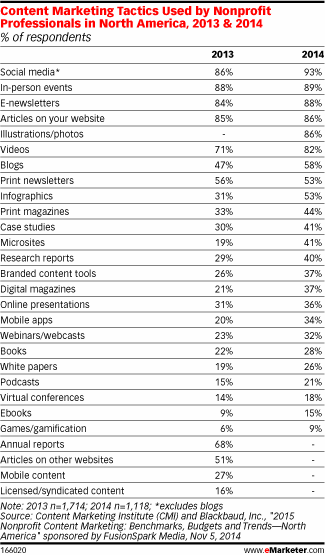
Read MoreTop Nonprofit Content Marketing Tactics, 2014 vs 2013 [TABLE]
Social media, cited by 93%, was the top content tactic nonprofit professionals used.
Read More