Video Games
In-Game Communication Among Online Gamers By Frequency, July 2013 [CHART]
The majority of gamers shied away from communication—almost 60% of gamers rarely or never interacted with other players.
Read MoreOnline Games Played By American Gamers, July 2013 [CHART]
57.8% of those playing online games were on single-player games.
Read MoreHow People Stream Netflix, June 2013 [CHART]
The majority of Netflix streamers reported watching the service on their PC.
Read MoreUS Hispanics' Mobile Activities During Travel, April 2013 [TABLE]
25% or more of US Hispanics said they sought places to eat, stay, shop and entertain themselves while they were on trips.
Read MoreMothers' Time Spent With Mobile Apps, May 2013 [CHART]
Gaming is the most time-consuming mobile app category among mothers.
Read MoreAmericans' Daily Time Spent With Online Media, 2010-2012 [TABLE]
Last year, social networks occupied 37 minutes of the average US consumer’s time per day, up considerably from 30 minutes per day in 2011.
Read MoreDaily Time Spent With Devices By US College Students, 2012 & 2013 [CHART]
Nearly seven out of 10 surveyed college students between the ages of 18 and 34 owned a smart phone in 2013, up 14 percentage points from 2012.
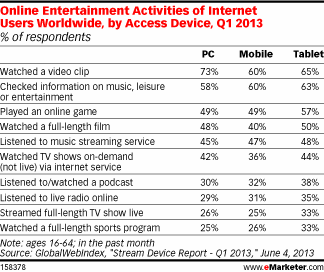
Read MoreGlobal Online Entertainment Activities By Device, Q1 2013 [TABLE]
Watching a video clip was the most popular activity, followed by checking for information on music, leisure or entertainment, and then playing an online game.
Read MoreDevices College Students Own, June 2013 [CHART]
The average 18-34-year-old college student owns 7 tech devices (6.9 to be precise), up from 6.4 last year.
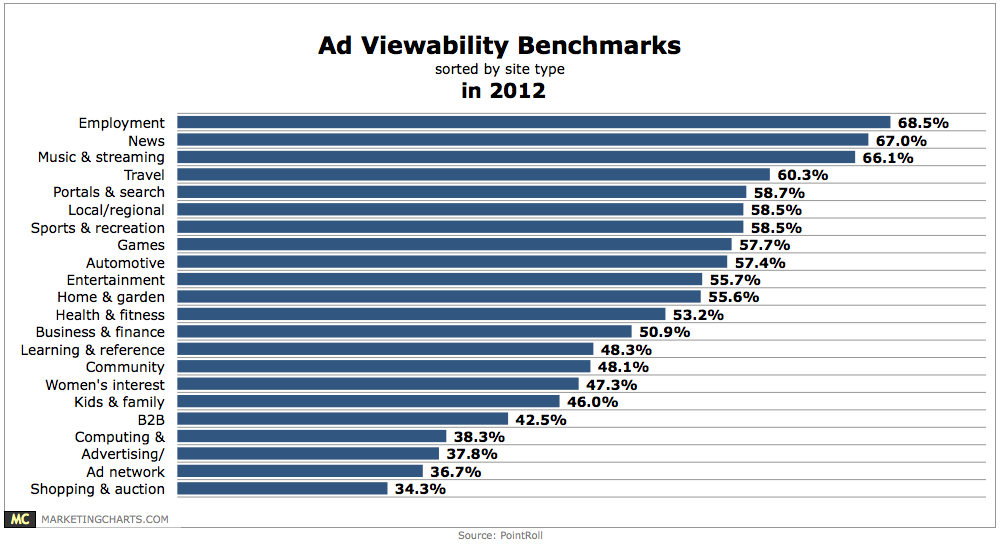
Read MoreAd Viewability Benchmarks By Site Type, 2012 [CHART]
Covering 2012 activity, the data shows that viewability rates were lowest on shopping and auction (34.3%) and ad network (36.7%) sites, and highest on employment (68.5%), news (67%) and music and streaming media (66.1%) sites.
Read More


