Video Games
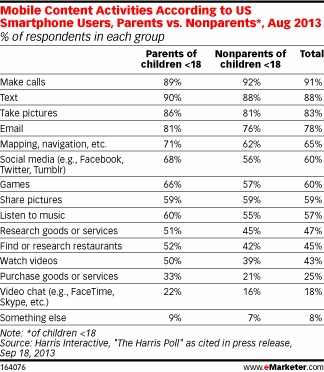
Mobile Content Activities Of American Parents, August 2013 [TABLE]
Parents of children under 18 were 5 percentage points more likely than nonparents to use email on their smart phone,
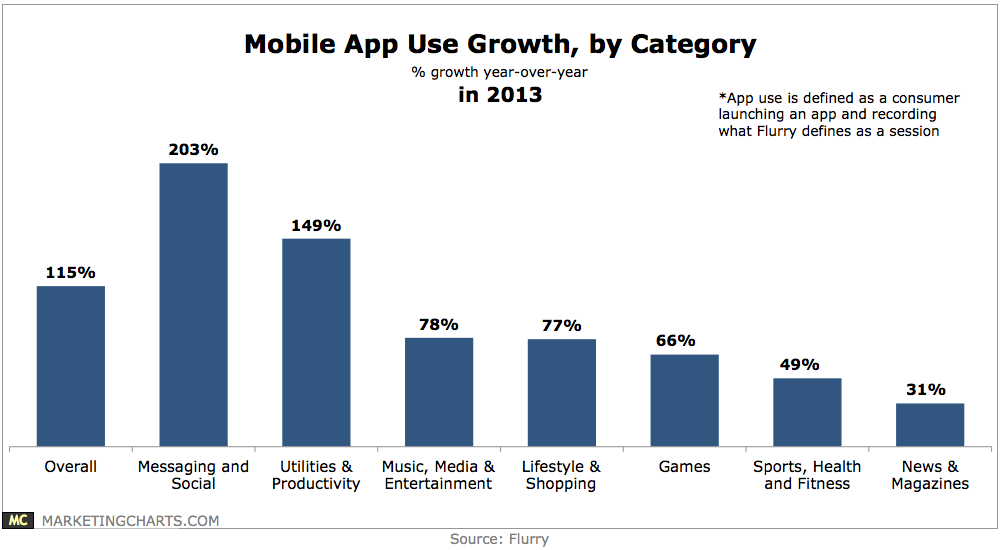
Read MoreMobile App Use Growth By Category, 2013 [CHART]
Mobile application use grew by 115% year-over-year in 2013,
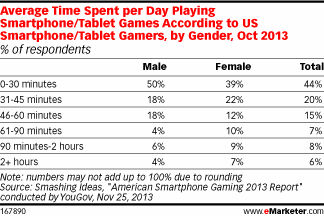
Read MoreAverage Daily Time Spent Playing Mobile Games By Gender, October 2013 [TABLE]
More than three-quarters of time US internet users spent with such content was on mobile, with desktop claiming just 22%.
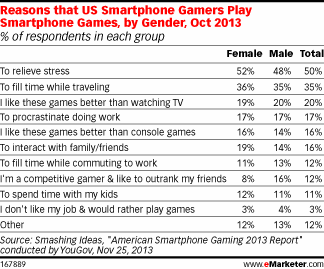
Read MoreReasons US Smart Phone Owners Play Mobile Games By Gender, October 2013 [VIDEO]
Half of US smart phone owners cited stress relief as their reason for playing smart phone games, the No. 1 response.
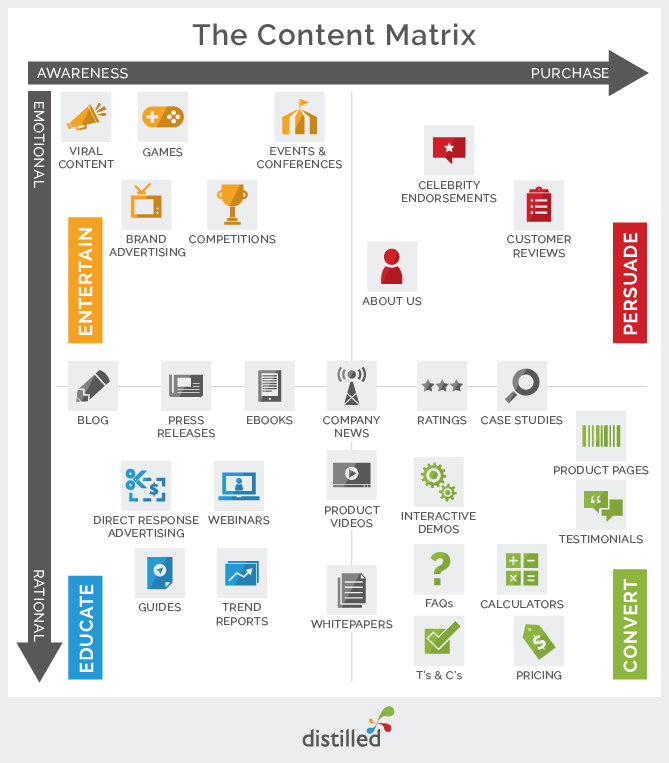
Read More4 Types Of Content For Marketing [CHART]
This superb chart by distilled breaks down content according to marketing goals, from awareness to purchase.
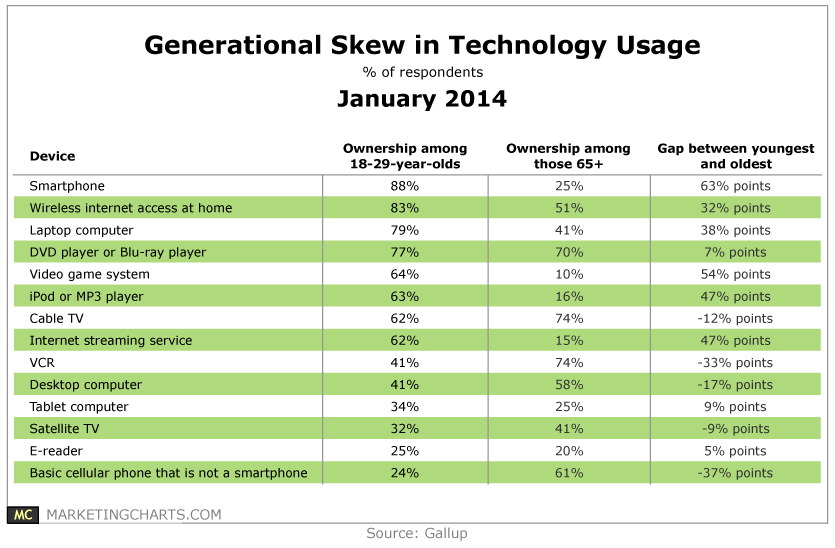
Read MoreTechnographic Generational Gap By Device, January 2014 [TABLE]
Gallup measured the penetration rates of 14 consumer electronic devices among 18-29-year-olds and those aged 65 and up.
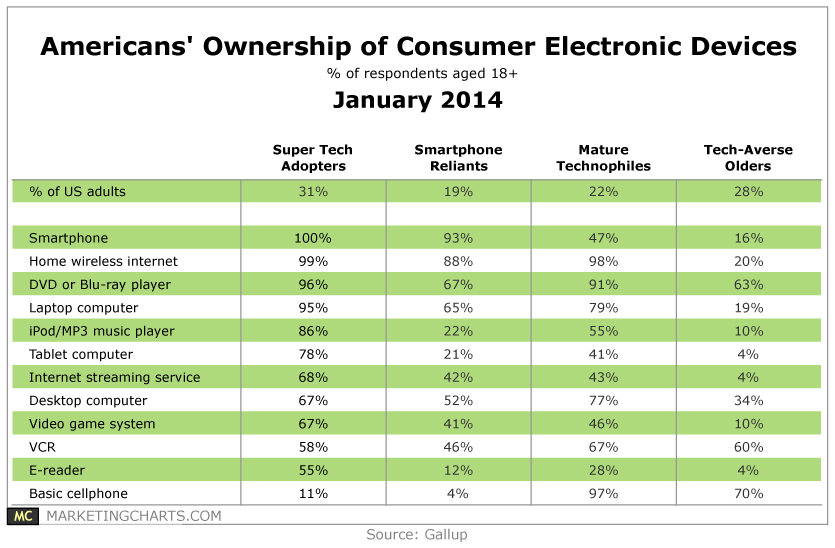
Read MoreConsumer Electronics Owned By Americans, January 2014 [TABLE]
Of the 12 consumer electronics devices identified, 9 see penetration rates of 67% or higher among Super Tech Adopters.
Read MoreUS Gaming Market Size By Screen, December 2013 [CHART]
170 million Americans play videogames, and 60% of those gamers spend money doing so, resulting in an estimated $20.5 billion in spending by the end of this year.
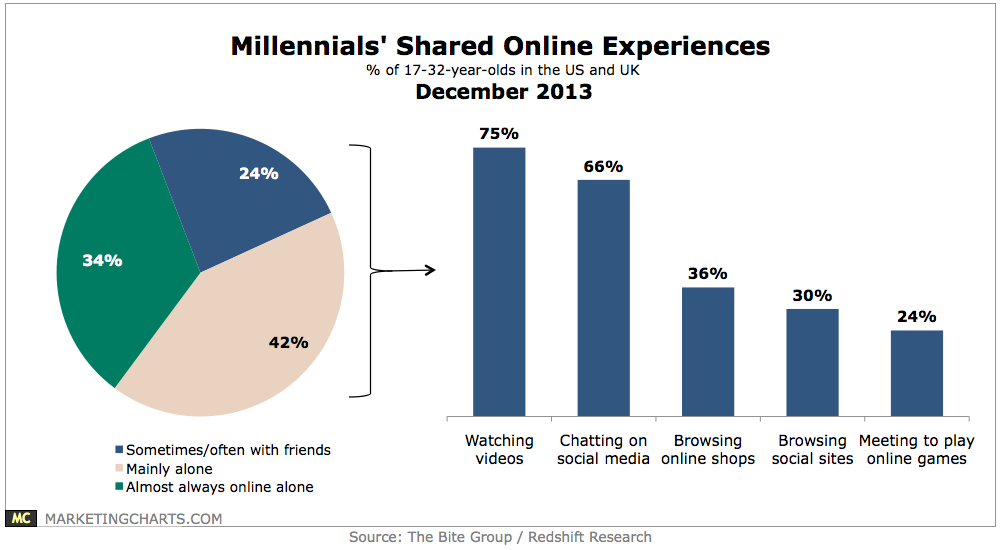
Read MoreMillennials' Shared Online Experiences, December 2013 [CHART]
Two-thirds of Millennials said they share at least some social experiences online.
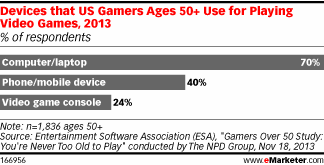
Read MoreDevices Boomers Used To Play Video Games, 2013 [CHART]
Seven in 10 gamers over 50 used a PC to play, while four in 10 used a phone or other mobile device.
Read More