Video Advertising
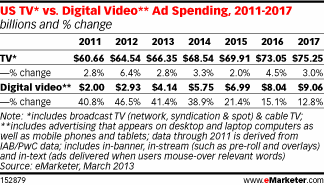
US TV vs Digital Video Ad Spending, 2011-2017 [CHART]
Spending on video ads served to PCs and mobile devices is expected to reach $4.14 billion this year, more than twice 2011 levels.
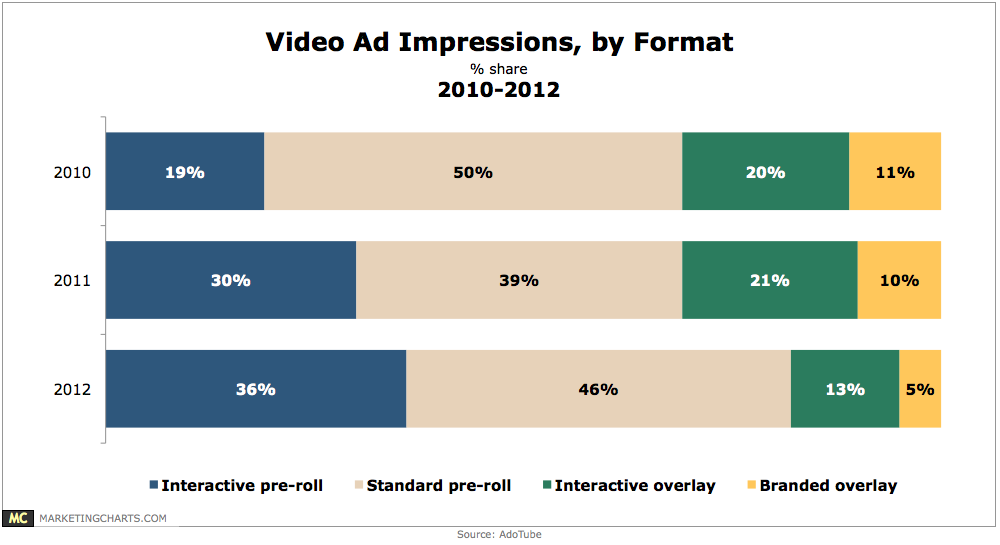
Read MoreVideo Advertising Impressions By Format, 2010-2012 [CHART]
Interactive pre-rolls represented 36% of video ad impressions in 2012.
Read MoreNative Video Ads vs Pre-Roll, March 2013 [CHART]
Native videos drove higher brand lift in each of the 5 campaigns studied compared to pre-roll video ads.
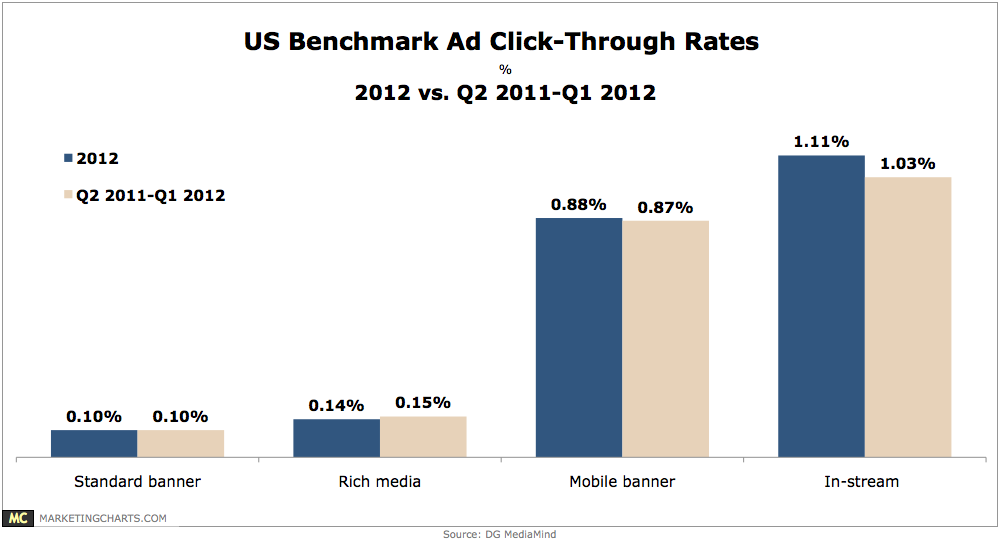
Read MoreUS Ad CTR Benchmarks By Format [CHART]
In the US, the average click-through rate (CTR) for in-stream video ads was 1.11% in 2012, up from 1.03% in the previous study (covering Q2 2011 – Q1 2012).
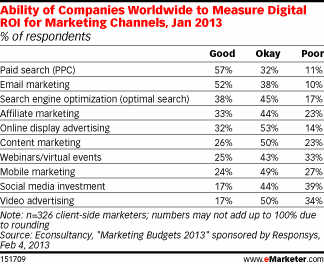
Read MoreMeasuring ROI For Online Marketing Channels, January 2013 [TABLE]
In January 2013, the greatest percentage of companies reported a good ability to measure the ROI of paid search.
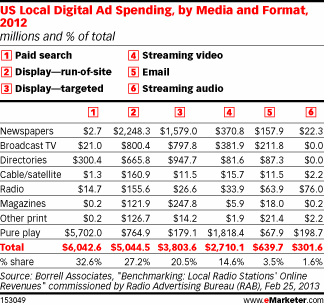
Read MoreUS Local Online Ad Spending By Media & Format, 2012 [TABLE]
The pace of increase helped expand digital radio advertising’s share of total local digital ad dollars by one-fifth of a percentage point, to 2% of the total.
Read MoreVideo Marketing Landscape [INFOGRAPHIC]
This infographic from LUMA Partners illustrates today’s complex video marketing landscape.
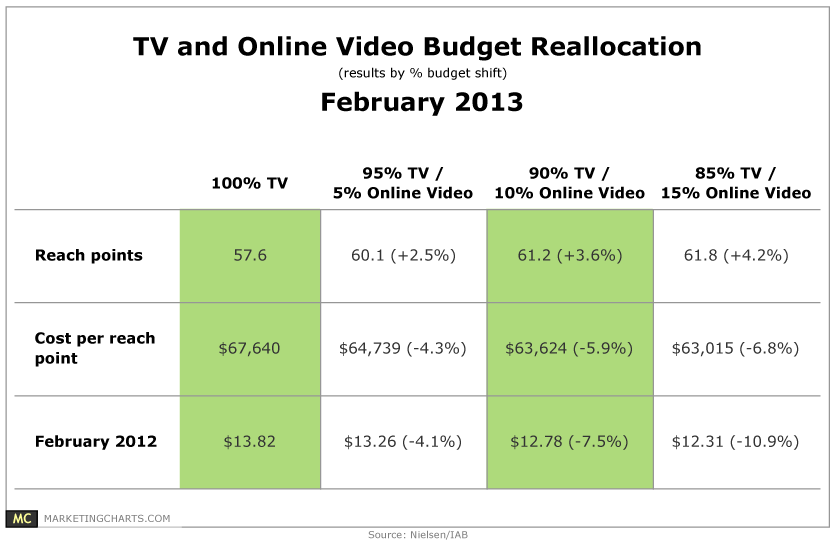
Read MoreTV & Online Video Budget Reallocation, February 2013 [TABLE]
15% reallocation of TV-only budgets resulted in a 4.2% increase in reach at an 11% lower CPM.
Read MoreBreakdown Of Top Brands Digital Marketing Budgets, December 2012 [CHART]
65% of top US brands reported participating in influencer marketing.
Read More