Video Advertising
Online Ad Revenue Share By Format, H1 2012 vs H1 2013 [CHART]
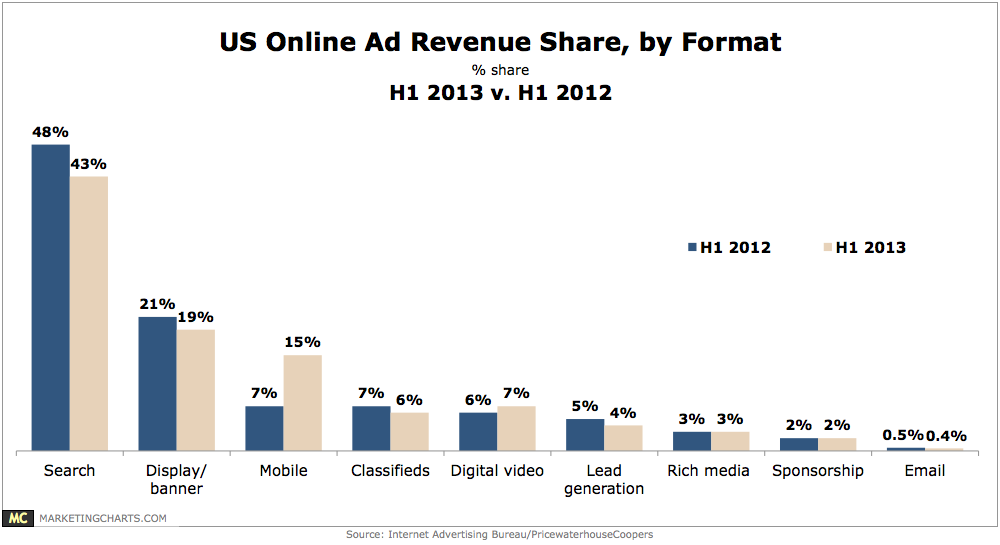
Display-related advertising continue to be the second-largest format, accounting for 30% of revenues in H1, down from 33% a year earlier as display’s 9% year-over-year rise trailed the overall average.
Read MorePharmaceuticals Ad Spending Outlook By Media, Fall 2012 & Spring 2013 [TABLE]
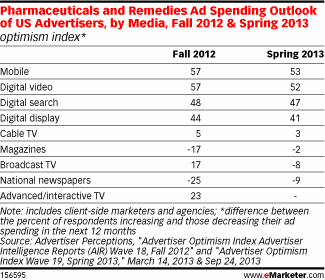
US advertising and marketing execs in the health care and pharma industry are more bullish on increases in digital advertising than on traditional tactics.
Read MoreMobile Video Ad Lengths, H1 2013 [CHART]
A majority 54% of mobile video ads are 30 seconds long, while another 32% are 90 seconds in length.
Read MoreTypes Of Mobile Advertising Currently Used, 2013 [CHART]
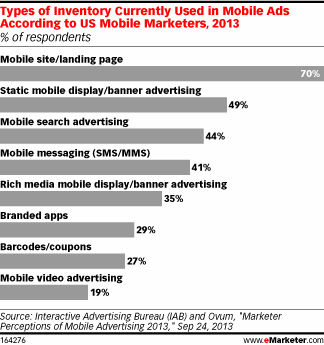
The greatest percentage of respondents—by a wide margin—employed mobile sites or landing pages, at 70%.
Read MoreReach & Frequency Of Video Ads, January – August 2013 [CHART]
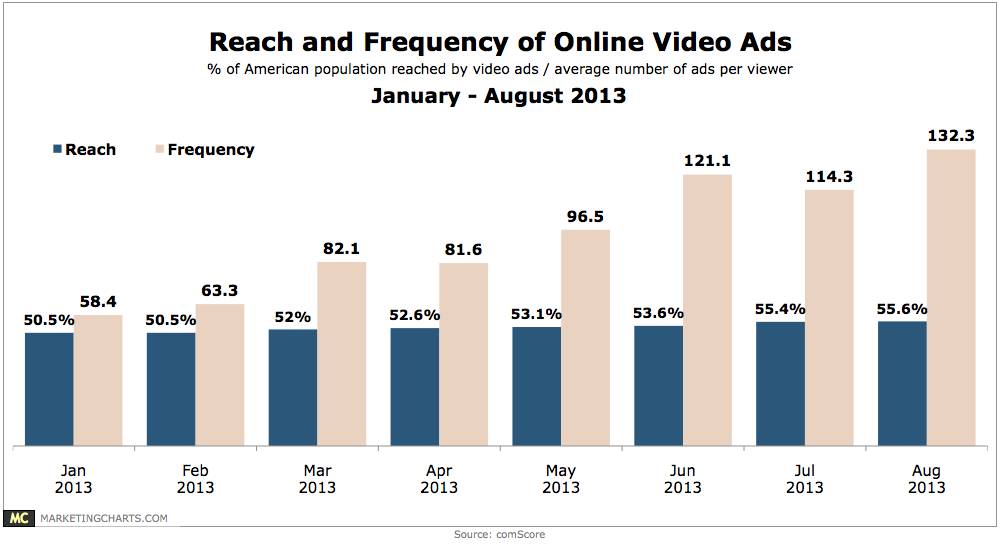
In August, the average viewer saw 132 ads, besting the previous high of 121 set in June, and more than doubling January’s average of 58.
Read MoreOnline Video Ad Views, December 2011 – August 2013 [CHART]
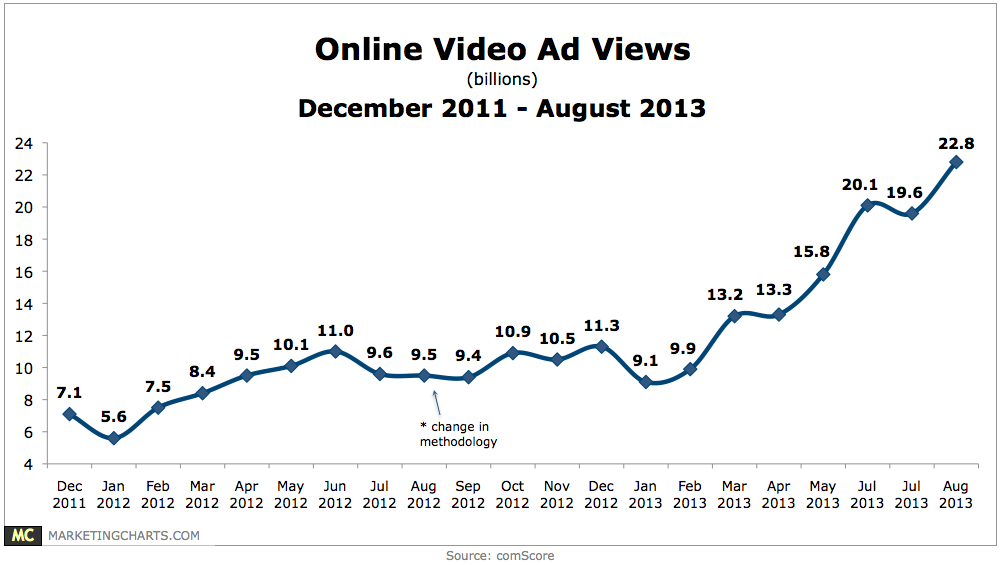
Online video ad views have been increasing rapidly this year, reaching a new high of 22.8 billion in August after a slight dip in July.
Read More
Online Video Ad Metrics By Size, Q1 2013 [TABLE]
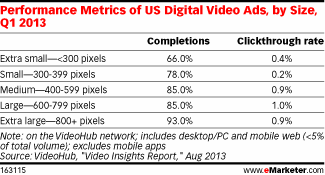
The larger the video ad, the higher the completion rate, with a 93.0% completion rate for extra-large video ads vs. a 66.0% completion for extra-small video ads.
Read MoreVideo Ad Completion Rates By Length, Q1 2013 [CHART]
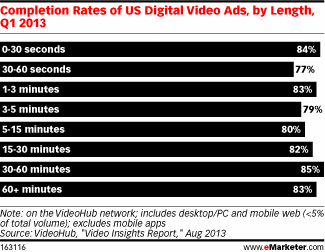
Completion rates were lowest for video ads that lasted between 30 to 60 seconds (77%), but ads that ran for 30 seconds or less saw an 84% completion rate.
Read MoreMobile Video Ad Views By OS, Q2 2013 [CHART]
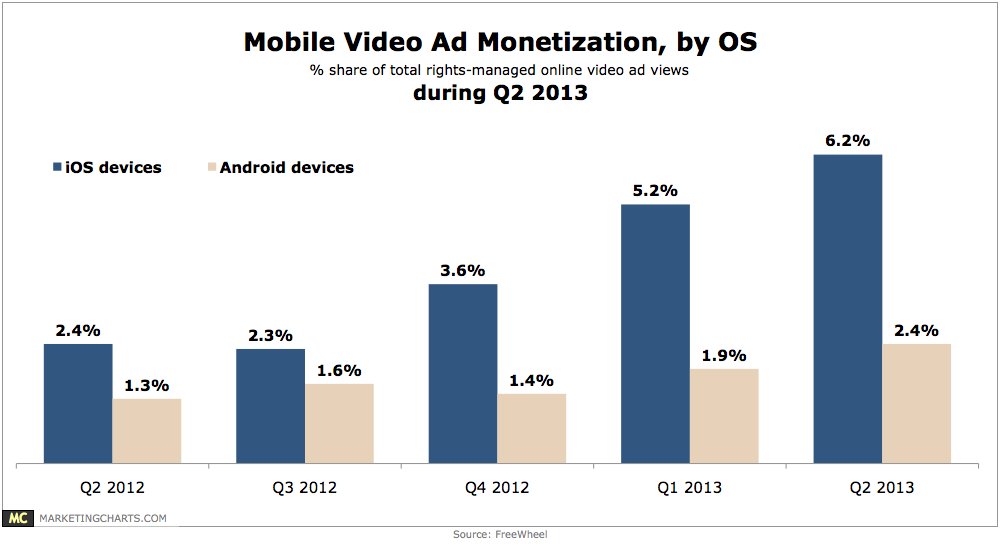
During the second quarter of the year, 17.5% of US rights-managed online video views occurred on a mobile phone (13.2%) or tablet (4.3%), almost double the 9.2% from Q2 2012.
Read More