Video Advertising
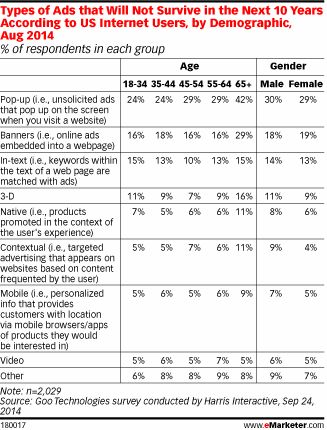
Types Of Ads Consumers Believe Will Disappear In 10 Years, August 2014 [TABLE]
29% of US internet users thought pop-up ads wouldn’t survive the next 10 years.
Read MoreLuxury Rich Media Ad Metrics vs Global Benchmarks, H1 2014 [TABLE]
The average clickthrough rate (CTR) for any polite banner ad in H1 2014 was just 0.13%. But for luxury ads of the same format, CTRs rose to 0.37%.
Read MoreUS Online Ad Revenue Share By Format, 2013-2014 [CHART]
Mobile ad spending comprises almost one-quarter (23%) of total online ad spend.
Read MoreConsumers’ Perceptions On The Future Of Advertising, September 2014 [CHART]
A majority of US adults surveyed indicated that advertisers will have more personal data about consumers in 10 years.
Read MorePurchase Intent Of Online Video Ads Viewers, July 2014 [CHART]
The device on which a consumer views video ads matters far more than mood or location—or even the content genre.
Read MoreBudget Shifts To Fund Video Advertising, September 2014 [CHART]
Video ad buyers are most likely to be drawing from display budgets to fund spending increases in the next 12 months.
Read MoreAverage Time Spent With Select Online Media, 2014 [CHART]
Facebook users’ attention is likely to be closely focused on content, where interspersed ads are not so easily ignored (even if users prefer they could be).
Read MoreChannels US Ad Execs Use For Programmatic Buying, June 2014 [CHART]
Programmatic TV advertising is still in its infancy due to limited buyer and seller adoption and lack of standardization of technology and infrastructure.
Read MoreUS Online Display Ad Spending Share By Format, 2013-2018 [CHART]
Video’s share of digital display ads in the US will gain significant ground throughout our forecast period, increasing from 21.6% of all digital display advertising last year to 30.1% by 2018.
Read MoreUS Video Ad Spending, 2013-2018 [CHART]
US digital video ad spending continues to increase significantly, up 56.0% this year to reach $5.96 billion.
Read More