Television Advertising
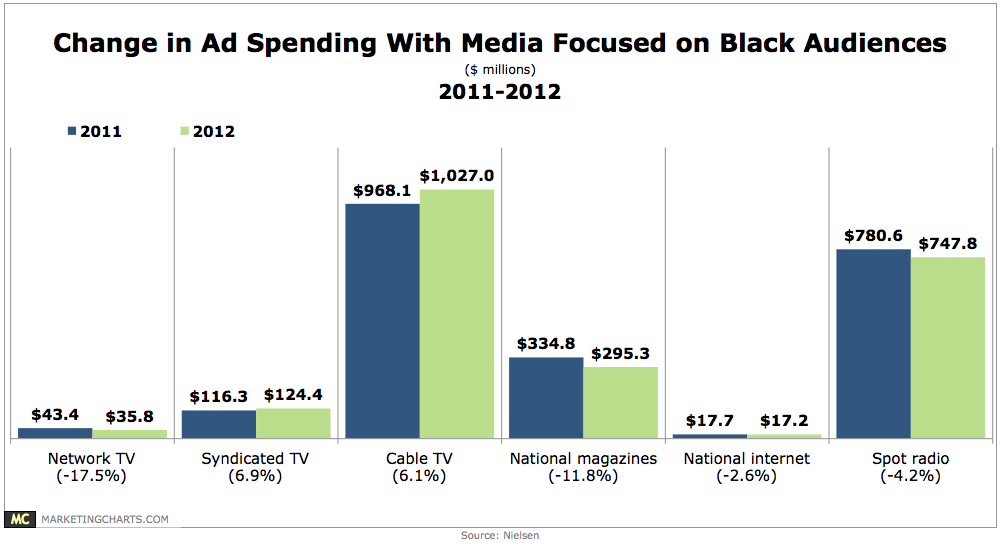
Change In Ad Spending With African American Media, 2011-2012 [CHART]
The Black or African-American population numbered 44.5 million as of July 2012.
Read MoreGlobal Ad Spending Growth By Medium, 2012-2015 [CHART]
Between 2012 and 2015, online ad spending should increase by $47.6 billion, or about two-thirds of the $71.7 billion in projected growth.
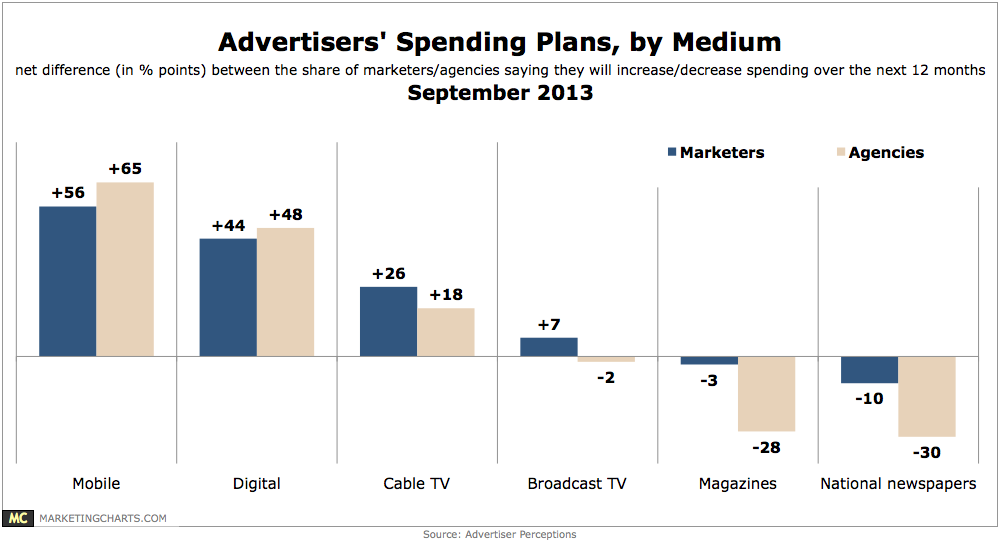
Read MoreAdvertisers' Spending Plans By Medium, September 2013 [CHART]
Enthusiasm for cable TV spending is high, with the share of respondents saying they plan to increase ad spending on cable TV outweighing the share indicating they’ll decrease spending.
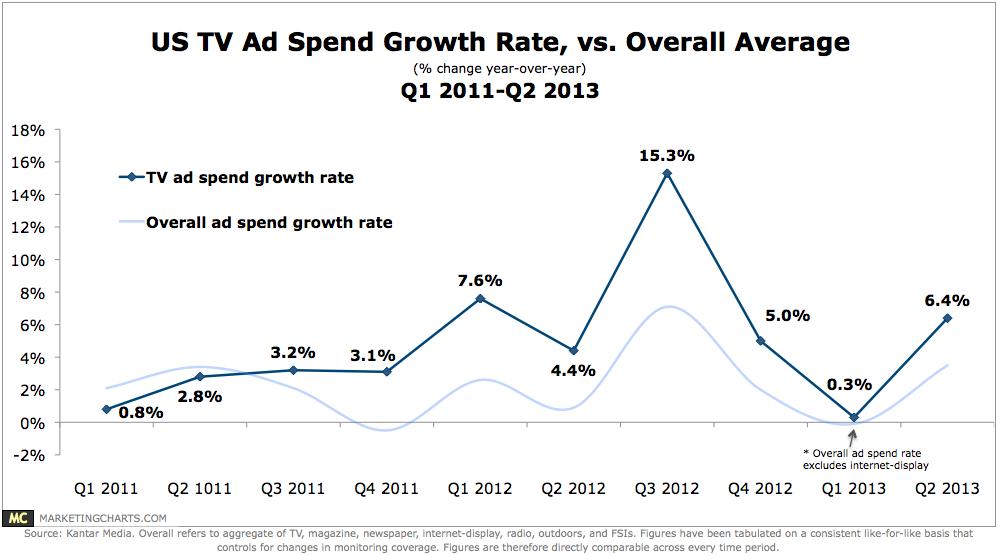
Read MoreUS TV Ad Spend Growth Rate, Q1 2011-Q2 2013 [CHART]
TV is the largest ad spending medium in the US, and its growth rates have been holding steady for some time.
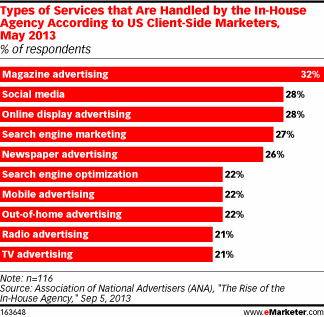
Read MoreTop In-House Marketing Agency Services, May 2013 [CHART]
Magazine advertising, social media, online display advertising and search engine marketing were the services most commonly handled by an in-house agency.
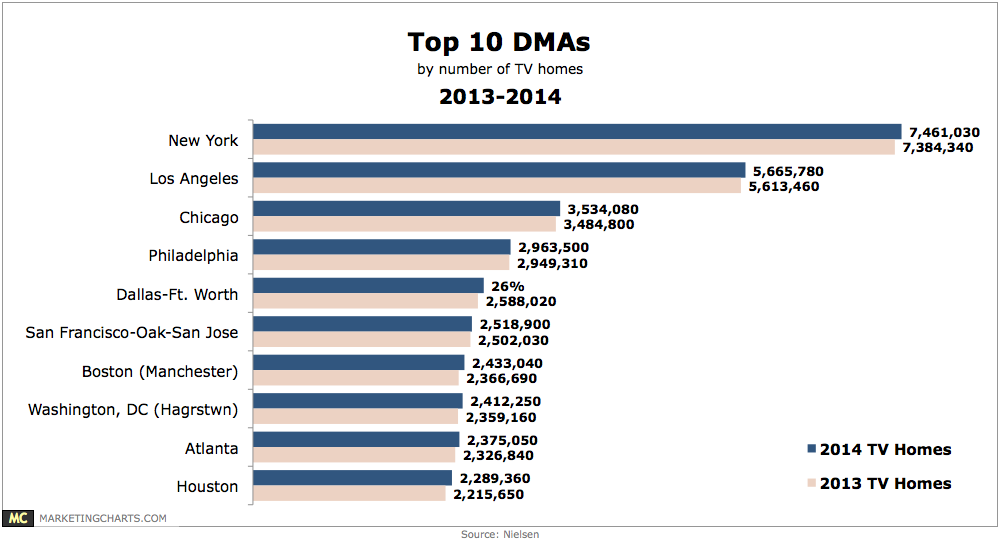
Read MoreTop 10 DMAs, 2013-2014 [CHART]
The number of TV homes overall increased by roughly 1.6 million (or about 1.4%), to 115.8 million.
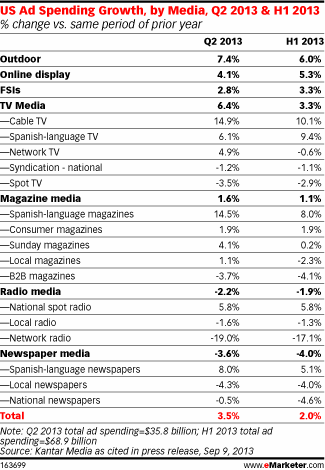
Read MoreUS Ad Spending Growth By Media [CHART]
For the first half of 2013, Kantar Media estimated that the total US ad spend market rose 2.0%, compared with the same period one year earlier.
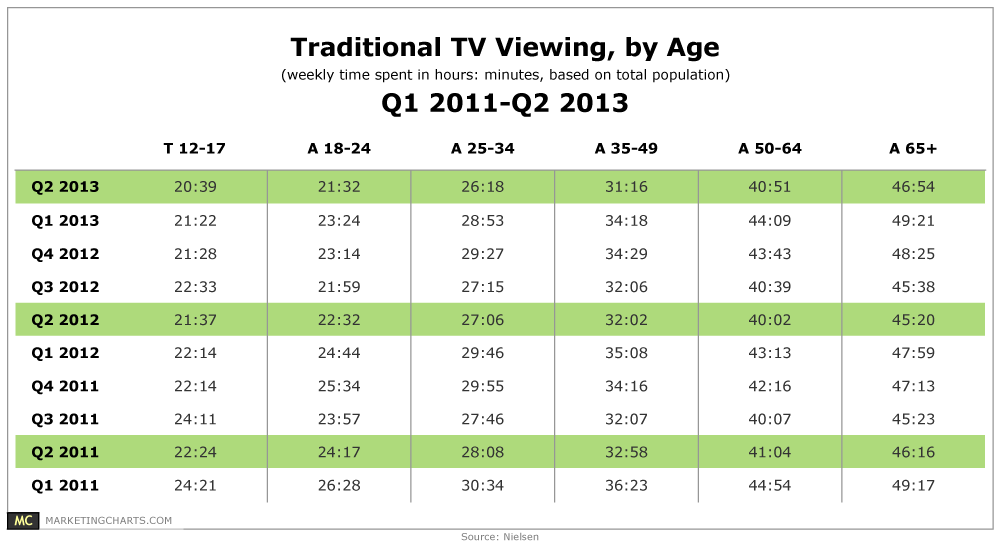
Read MoreWeekly Time Spent Watching TV By Age, Q1 2011-Q2 2013 [TABLE]
While youth are indeed watching less TV, it’s not yet a precipitous decline than widely assumed.
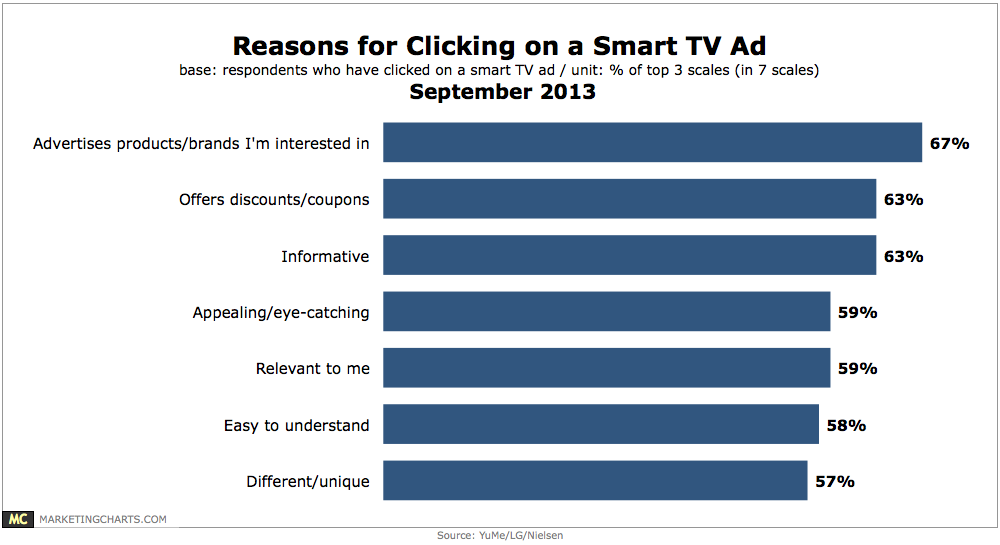
Read MoreReasons People Click On Smart TV Ads, September 2013 [CHART]
Most said it was because they were interested in the advertised product or brand.
Read More