Television Advertising
Social Media In 2013 [INFOGRAPHIC]
This infographic illustrates significant events in social media during 2013.
Read MoreGlobal Ad Spending Growth By Medium, Q1-Q3 2013 [CHART]
Global ad spending across major media grew by 3.2% year-over-year during the third quarter of 2013.
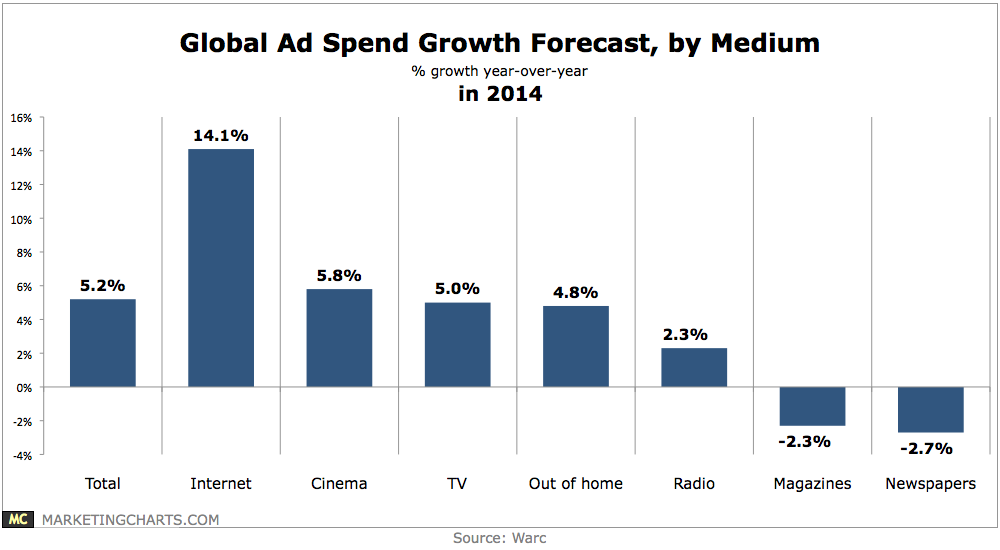
Read MoreGlobal Ad Spending Growth By Medium In 2014 [CHART]
Global ad spending will increase by 5.2% this year, a significant uptick from the predicted growth of 3.2% for 2013, but a slight cut from a prior forecast of 5.4% growth.
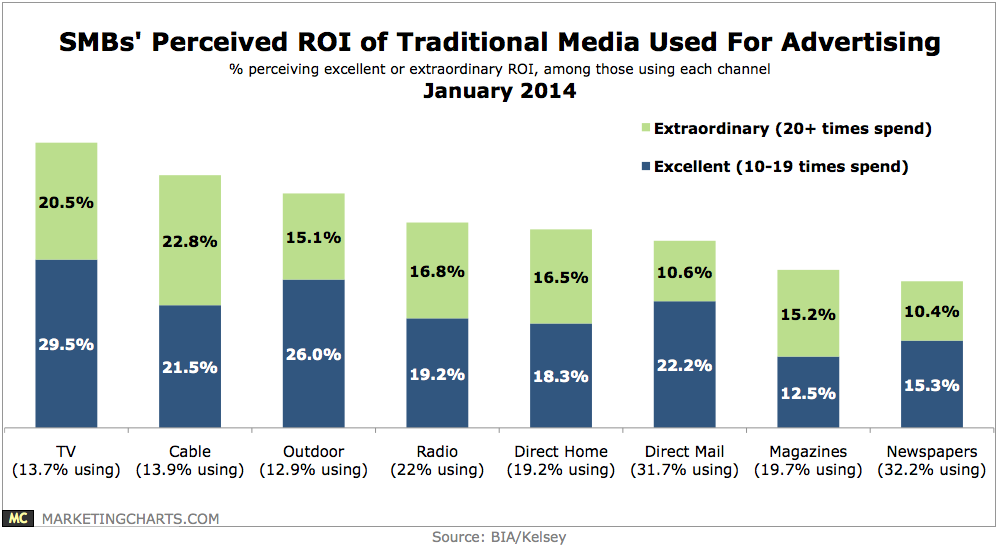
Read MoreSMBs' Perceived ROI Of Traditional Media Advertising, January 2014 [CHART]
Newspapers (32.2%) and direct mail (31.7%) are the traditional media most commonly used by SMBs for advertising and promotion,
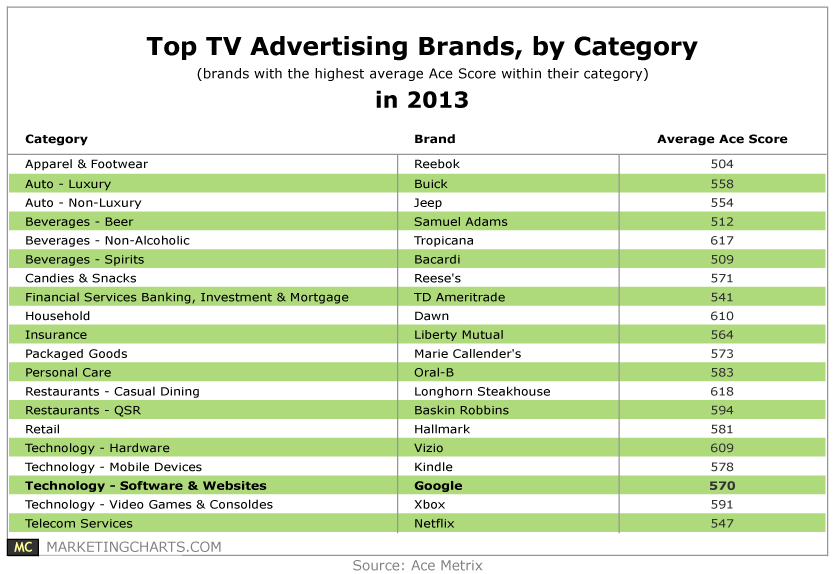
Read More2013 Top TV Advertising Brands By Category [TABLE]
Google was named Brand of the Year and also aired the most effective commercial of the year, its Zeitgeist-themed Here’s to 2013.
Read More2014 Marketing Budget Plans By Channel [CHART]
9 in 10 business leaders plan to either increase (46%) or maintain (47%) their marketing budgets in 2014.
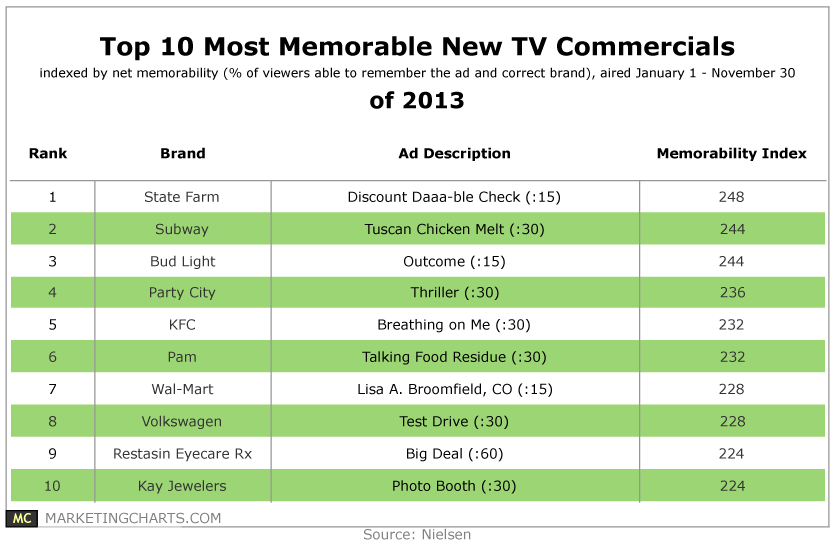
Read More10 Most Memorable TV Ads Of 2013 [TABLE]
Nielsen recently issued its lists of the year’s most memorable new commercials and best branded product integrations in scripted shows.
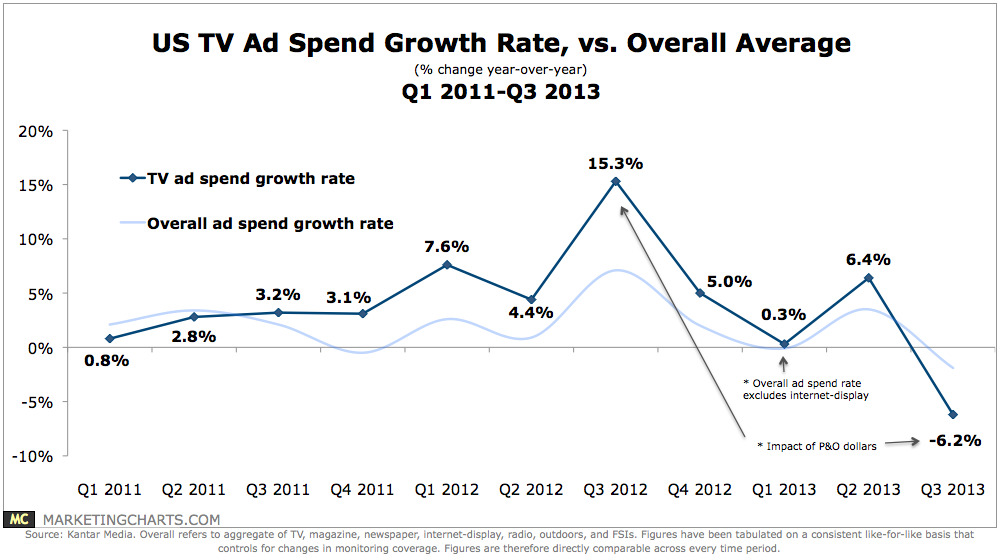
Read MoreUS TV Ad Spending Growth Rate vs Overall Average, Q1 2011-Q3 2013 [CHART]
TV ad spending remains healthy even as the medium appears to have reached a plateau in audience numbers.
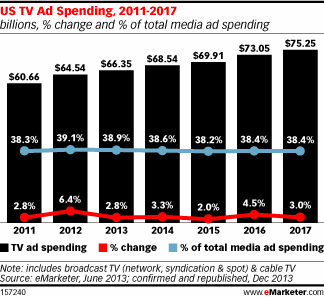
Read MoreUS TV Ad Spending, 2011-2017 [CHART]
TV advertising expenditures are set to climb from $66.35 billion to $75.25 billion between 2013 and 2017.
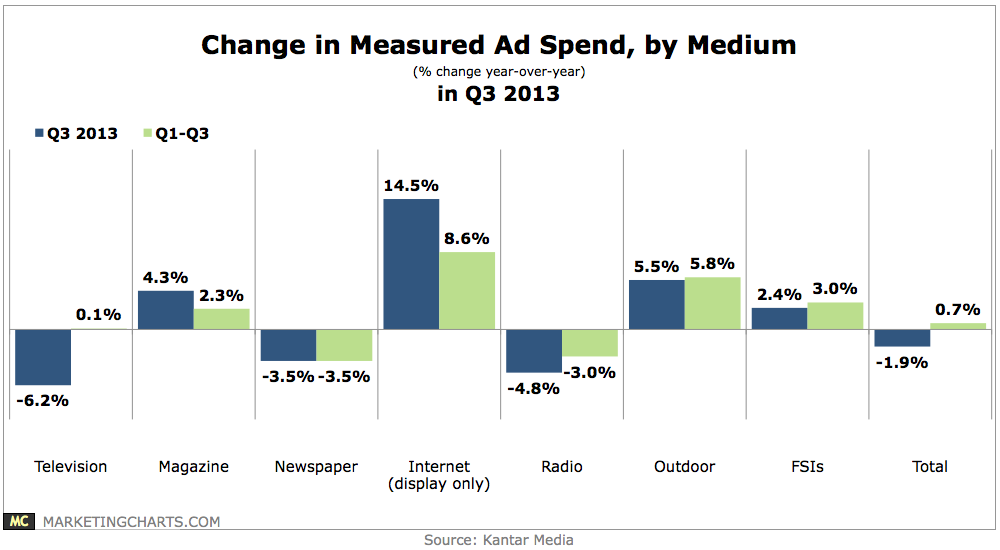
Read MoreChange In Ad Spend By Medium, Q3 2013 [CHART]
Total ad expenditures in Q3 were down 1.9% year-over-year, an unsurprising result given last year’s outlays on the Summer Olympics and political campaigns.
Read More

