Social Television
Reach Of Facebook vs. TV By Age, August 2013 [CHART]
During the weekday daytime hours, Facebook’s PC-only reach is greater than either of the networks among all age groups except for the 55-64 and 65+ brackets.
Read MoreMultitainment In The UK, August 2013 [CHART]
Media stacking is more common than media meshing, with 49% of UK adults engaging in the former on a weekly basis, compared to 25% for the latter.
Read MoreCollege Students' Multitainment Activities, February 2013 [CHART]
The most popular activity students engaged in while watching TV was using Facebook or Twitter, at 63% of respondents.
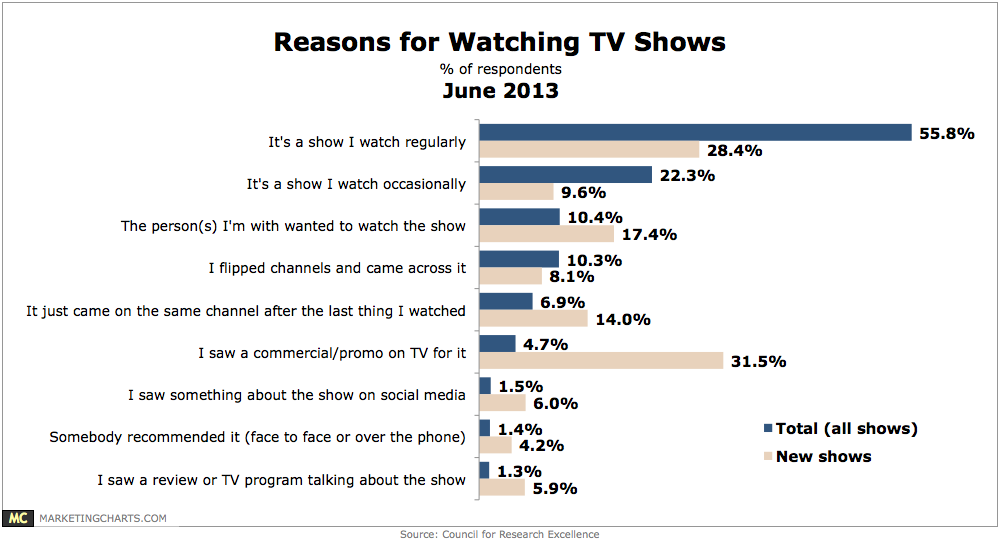
Read MoreWhy People Watch A Particular Television Show, June 2013 [CHART]
The proportion of study respondents who interact with TV-related content on social media on at least a weekly basis is triple those who do so on a daily basis (37% vs. 12%).
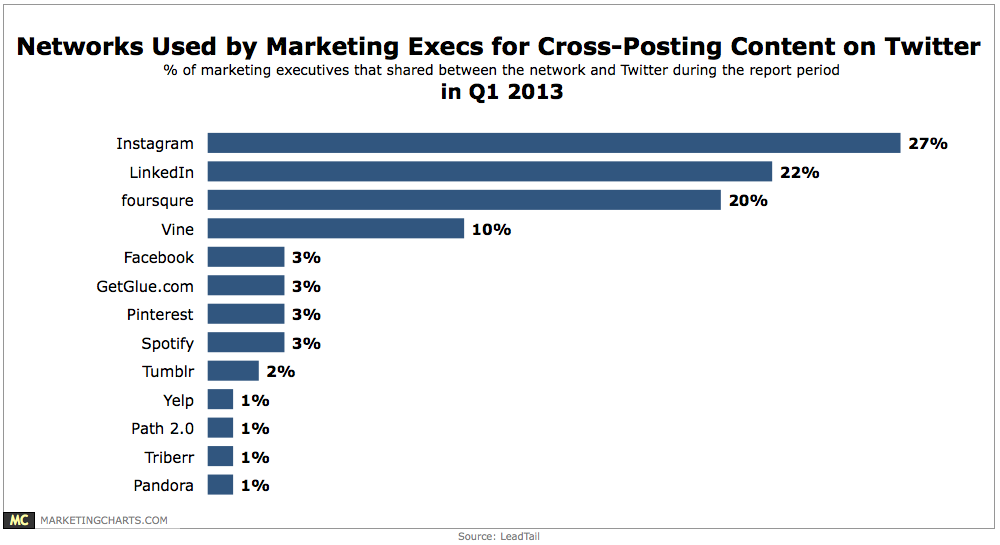
Read MoreSocial Media Sites Marketing Execs Use For Cross-Posting On Twitter, Q1 2013 [CHART]
27% of marketing execs shared content between Instagram and Twitter, 22% shared content with LinkedIn, 20% with foursquare, and 10% with Vine.
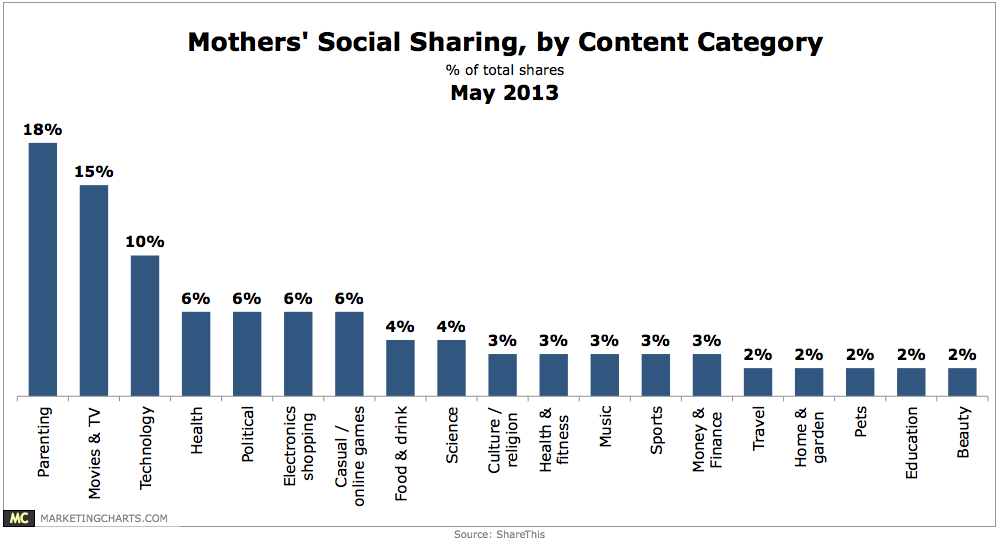
Read MoreMoms' Social Sharing By Content Type, May 2013 [CHART]
30% of mothers shared content on the ShareThis network during the period, compared to 10% of the network’s overall average.
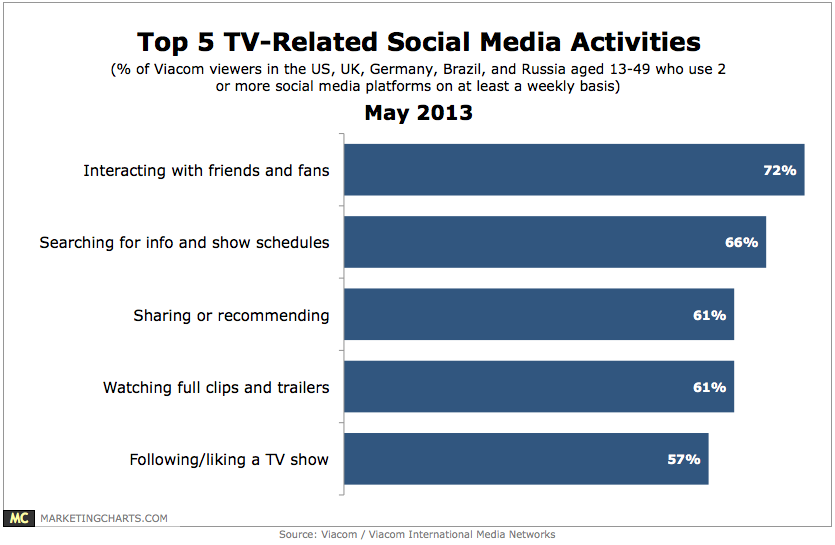
Read MoreTop 5 TV-Related Social Media Activities, May 2013 [CHART]
Viewers average 10 TV-related activities on social media on a weekly basis.
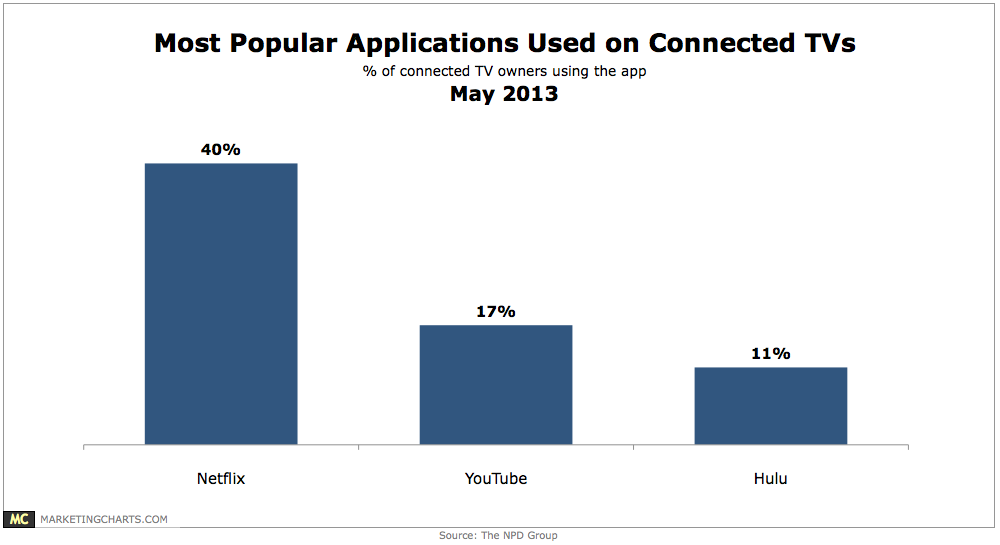
Read MoreMost Popular Connected TV Apps, May 2013 [CHART]
40% of connected TVs are streaming content from Netflix, compared to just 17% used to watch video on YouTube, and 11% to watch Hulu or Hulu Plus.
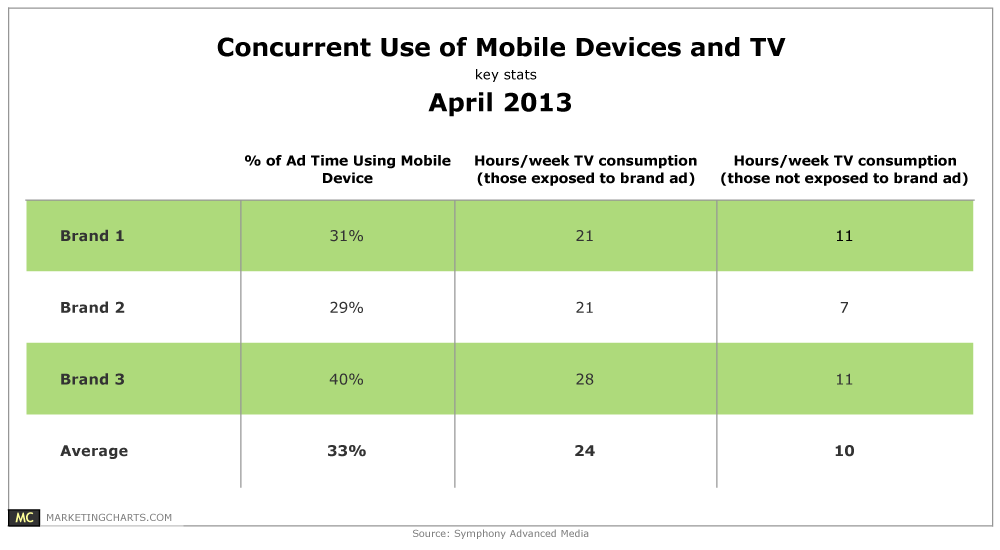
Read MoreTime Spent On Multitainment Activity, April 2013 [TABLE]
30-40% of actual TV ad viewing occurred concurrently with mobile device usage.
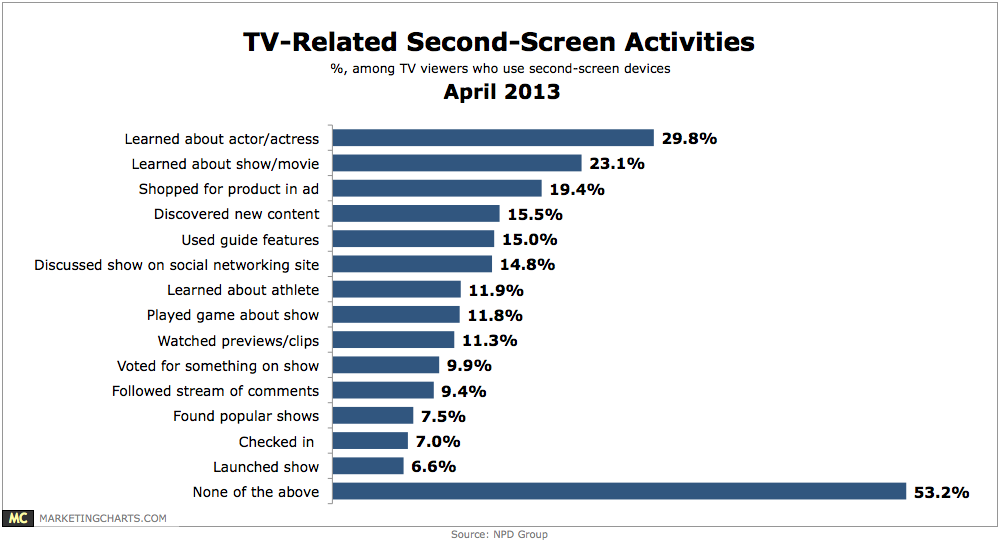
Read MoreSecond Screen TV-Related Behavior, April 2013 [CHART]
Among the most common is shopping for a product seen in an ad, by 19.4% of TV watchers who engage in second-screen activities.
Read More