Social Sharing
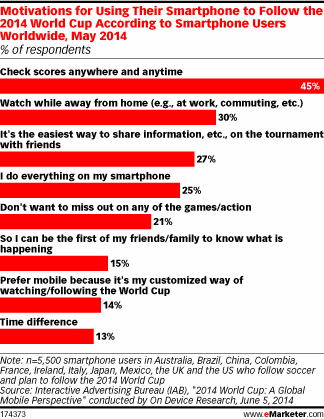
Reasons People Use Their Smart Phone To Follow World Cup, May 2014 [CHART]
Being able to stay in the know about World Cup scores was the top motivation for using their phones.
Read MoreWorld Cup Fans' Online Behavior [INFOGRAPHIC]
This infographic by RadiumOne illustrates World Cup fans’ cross-device usage and social media sharing.
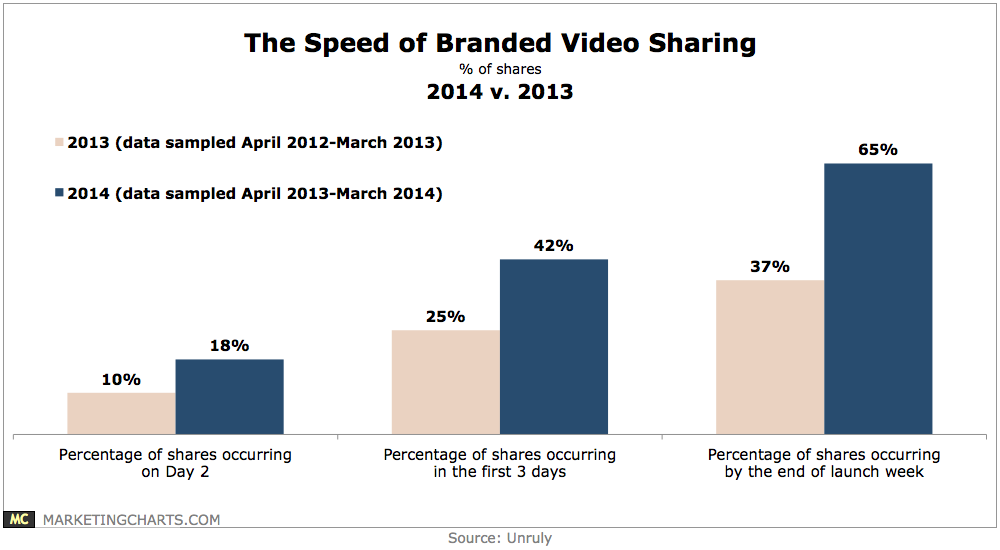
Read MoreSpeed Of Branded Video Sharing, 2013 vs 2014 [CHART]
An average 42% of shares now occur during the first 3 days of launch, up from 25% last year.
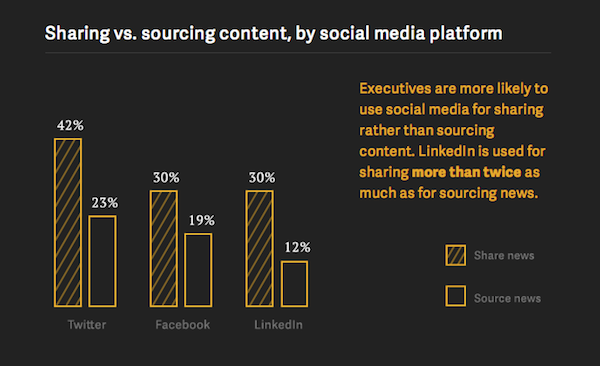
Read MoreExecs' Social Media Use: Sharing vs. Sourcing [CHART]
91 percent of executives said they would share work-related news with others.
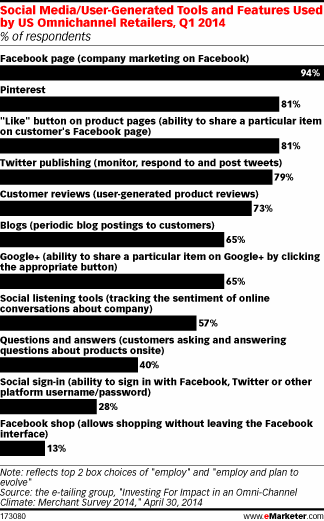
Read MoreSocial Media Tools & Features Used By US Omnichannel Retailers, Q1 2014 [CHART]
94% of US omnichannel retailers had a Facebook page, and 81% had a Like button on product pages, allowing customers to share a particular item of interest.
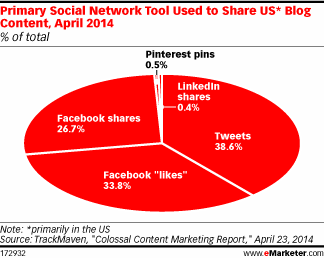
Read MorePrimary Social Tool Used To Share Blog Content, April 2014 [CHART]
When blog readers do share via social, they’re likely doing so on Facebook.
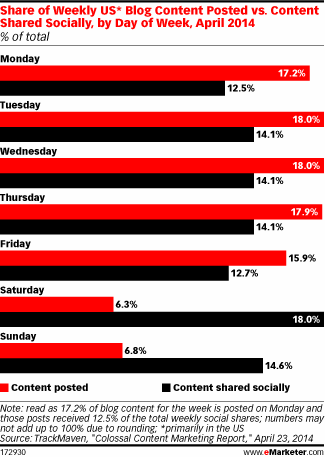
Read MoreShare Of Weekly US Blog Posts vs Social Shares By Day Of The Week, April 2014 [CHART]
Bloggers were most likely to post their content on weekdays, with 87% of weekly blog content pushed out between Monday and Friday.
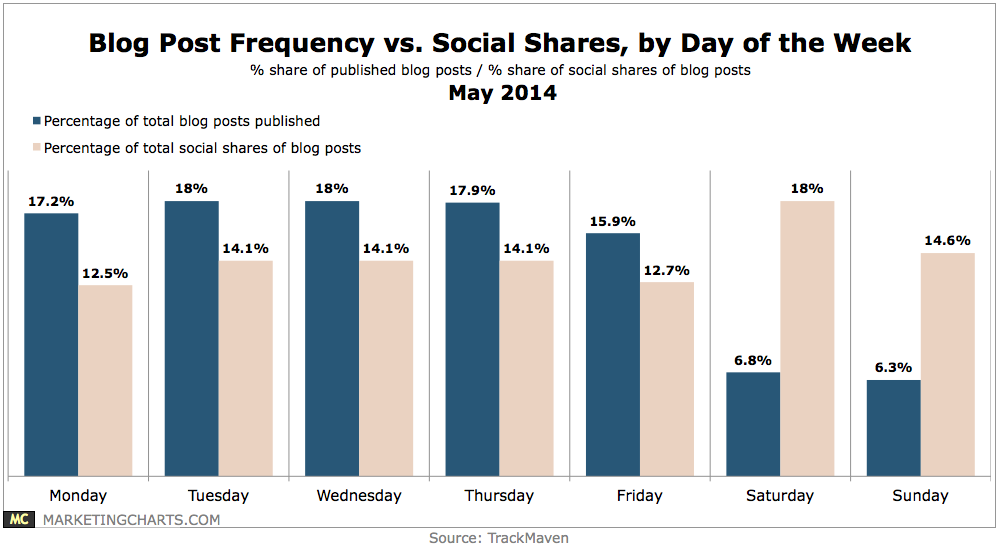
Read MoreBlog Post Frequency vs Social Shares By Day Of The Week, May 2014 [CHART]
While just 13% of the more than 1 million blog posts analyzed were published on the weekend, those posts received almost one-third of the data set’s total number of social shares.
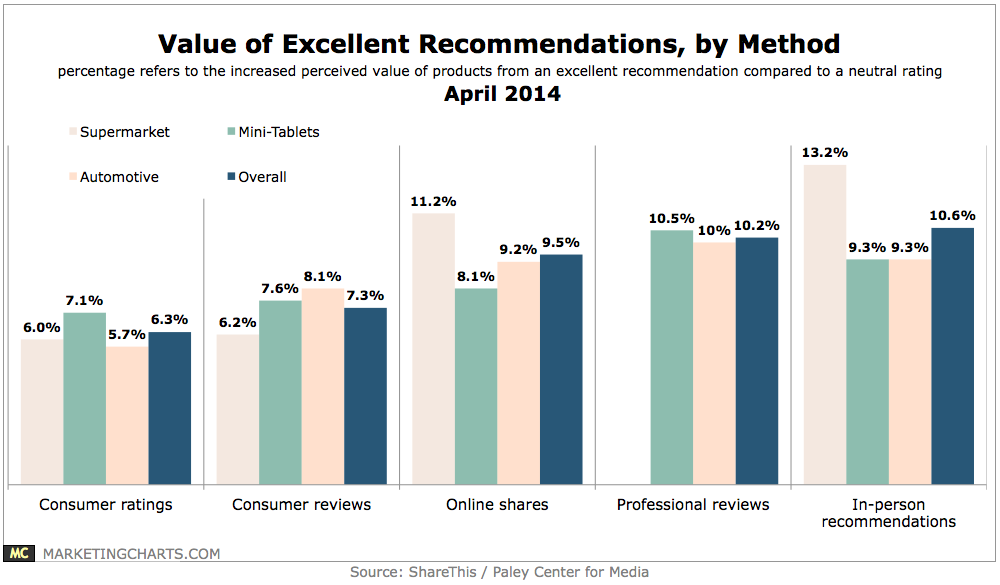
Read MoreValue Of Excellent Recommendations By Method, April 2014 [CHART]
Recommendations are received with a degree of trust and influence unmatched by any paid media.
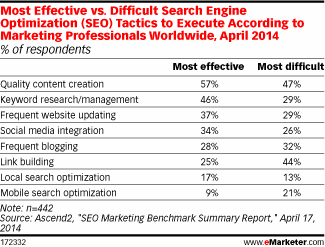
Read MoreMost Effective vs Difficult SEO Tactics, April 2014 [TABLE]
Quality content creation was the most effective SEO tactic, cited by 57% of marketers.
Read More