Social Media Marketing
Top New App Discovery Methods [CHART]
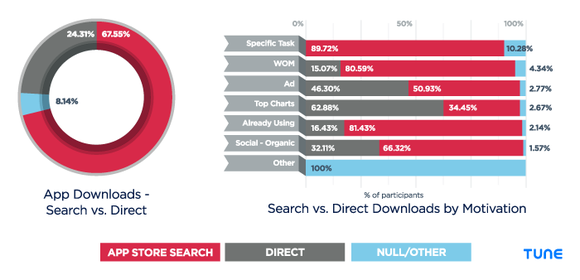
App store search accounts for more than 67% of actual new app discovery.
Read MoreAverage Daily Time Spent With Media, 2012-2018 [TABLE]
Thanks to media multitasking, US adults will squeeze an average of 12 hours, 5 minutes per day of media usage into their waking hours this year—nearly an hour more than the average in 2011.
Read MoreHow People Discover Small Businesses [CHART]
More than one-third of US internet users said they first find out about small businesses when researching online.
Read MoreFacebook Post Reaction Share By Type [CHART]
The lion’s share (97.0% ) of Facebook post reactions consist of Likes.
Read MoreMultitainment Behavior By Generation [CHART]
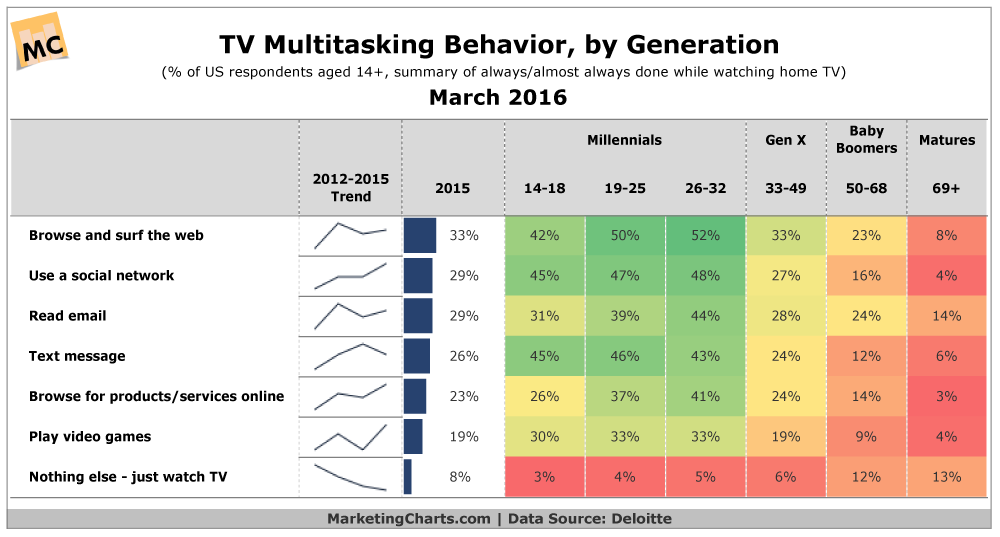
More than 9 in 10 US consumers aged 14 and older say they typically multitask while watching TV, up from about 8 in 10 just 3 years earlier.
Read MoreTop Purchase Influences By Generation [CHART]
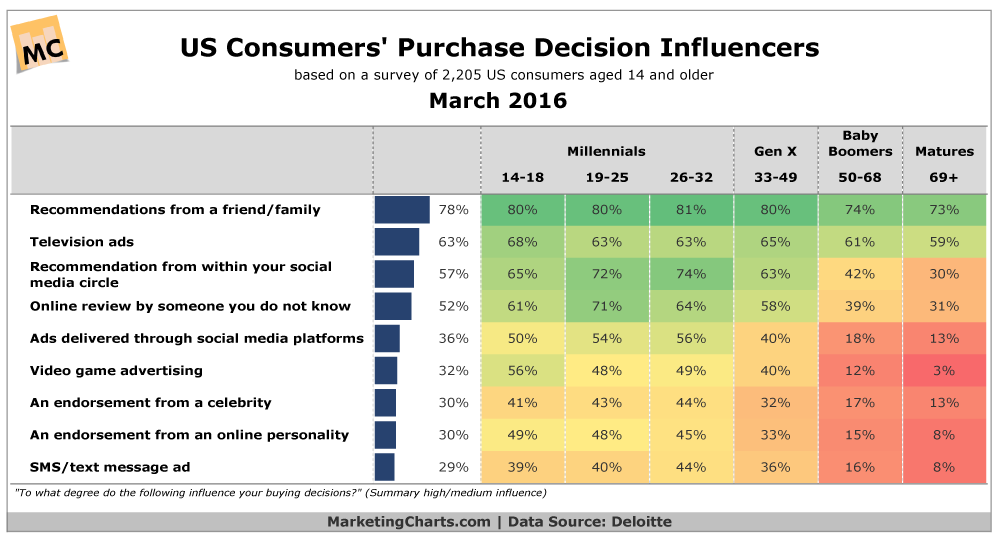
Word-of-mouth influences the purchases of more US consumers than TV ads, a finding that holds true across generations.
Read MoreManaging Your Online Reputation [INFOGRAPHIC]
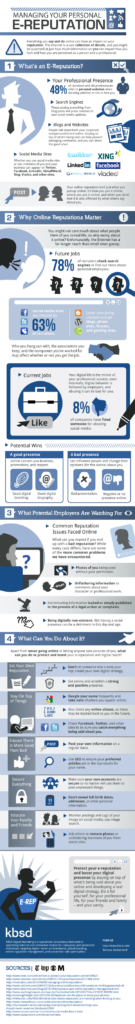
This infographic from KBSD illustrates how to manage your online reputation with facts, stats and tips.
Read MoreThe Fox News Effect [CHART]
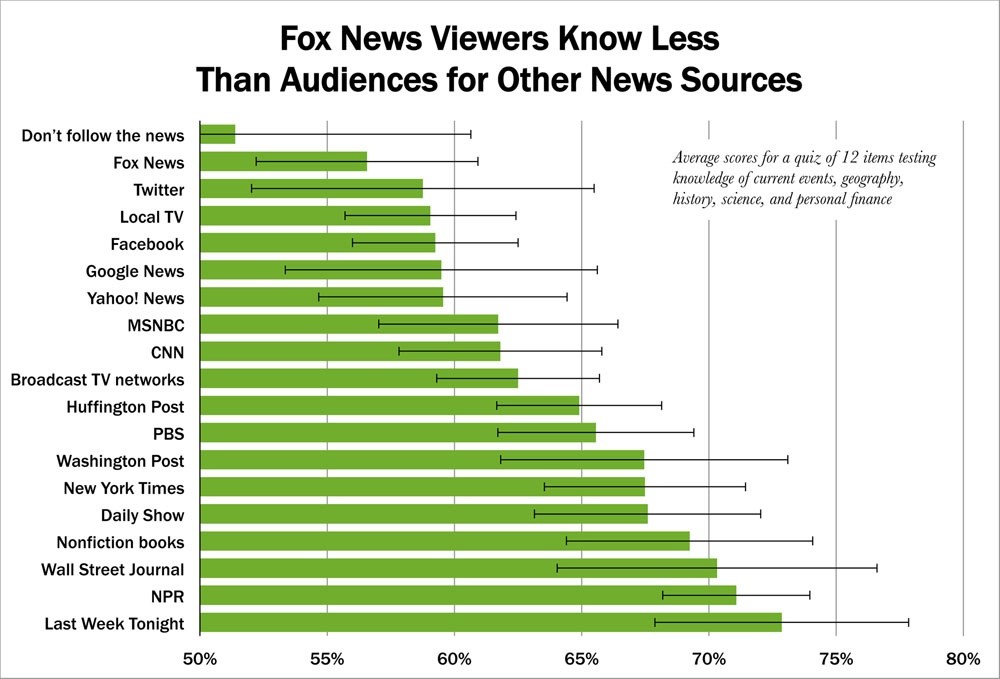
Fox News viewers scored the lowest of over 30 popular news sources (though Fox viewers did at least score better than those saying they didn’t follow the news).
Read MoreFemale Brand-Related Activity By Generation [TABLE]
Almost three-quarters of female internet users said they prefer marketing messages to be gender neutral.
Read MoreGlobal Twitter Users, 2014-2020 [CHART]
eMarketer estimates that worldwide, user growth of 10.9% this year will bring Twitter’s monthly active population to 286.3 million by the end of this year.
Read More