Social Media Marketing
Social Sharing Destination Preferences, Q3 2013 [CHART]
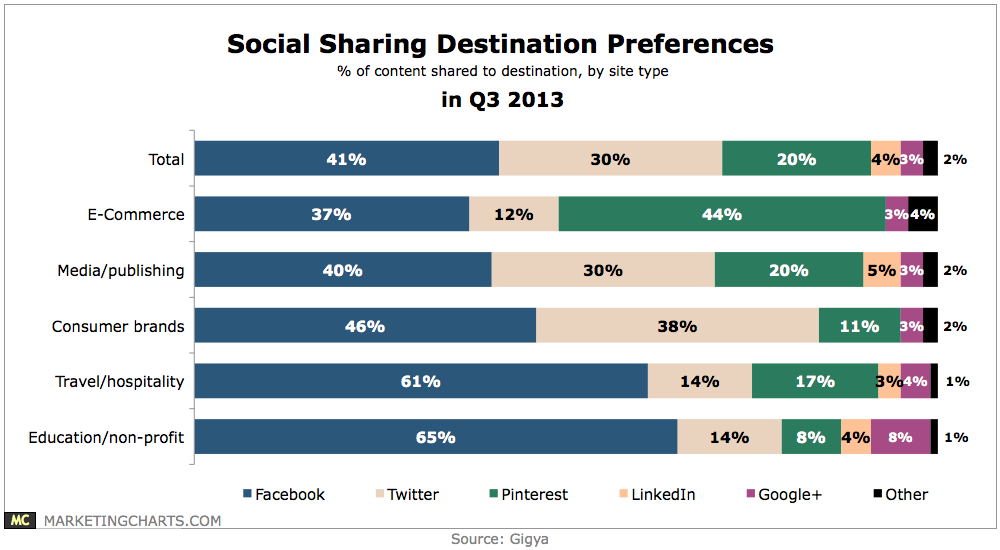
About 20% of content shared to social networks was shared to Pinterest during Q3, up from 16% in Q2.
Read MoreMost Popular Content Types For B2B Tech Buyers, December 2013 [CHART]

White papers top the list, with 49% of respondents claiming to have used them to evaluate a tech purchase in the prior 6 months.
Read MoreFacebook Traffic Referral Trends, September 2012 – November 2013 [CHART]
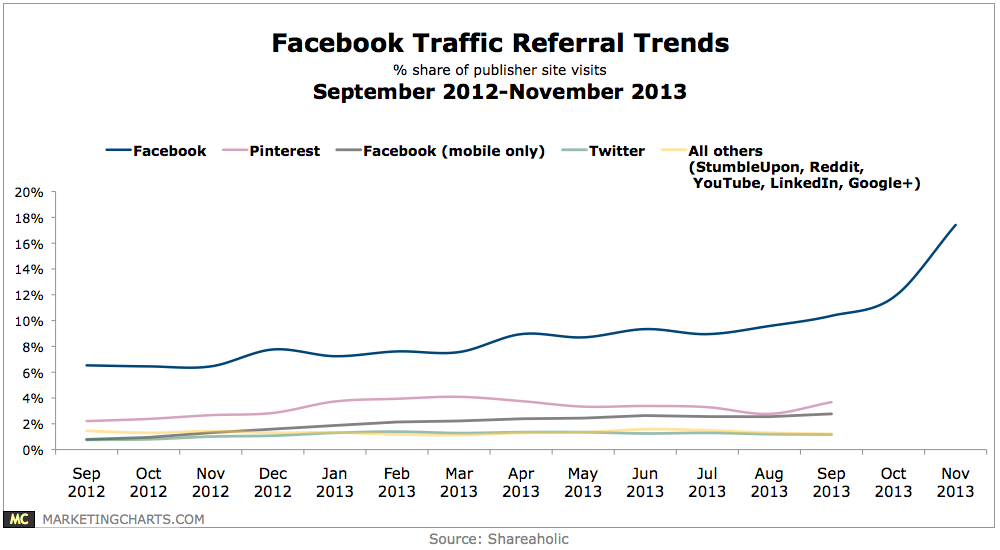
More than 1 in 6 visits to the average publisher came from a Facebook referral.
Read MoreSocial Engagement With Brands, December 2013 [TABLE]
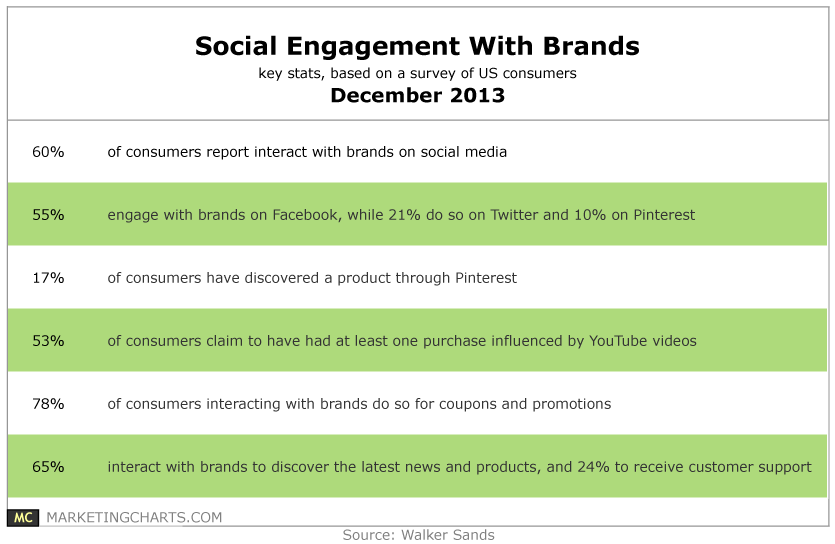
Almost 1 in 5 consumers claim to have discovered a product through Pinterest, while YouTube videos have influenced a purchase at least once for 53% of respondents.
Read MoreUS Mothers' Smart Phone Activities, 2011 & 2013 [TABLE]
Escapism (39%), social (23%), and shopping (12%) were the most popular functions among mothers glued to their mobiles.
Read MoreConsumer Attitudes Toward Online Reviews, December 2013 [CHART]
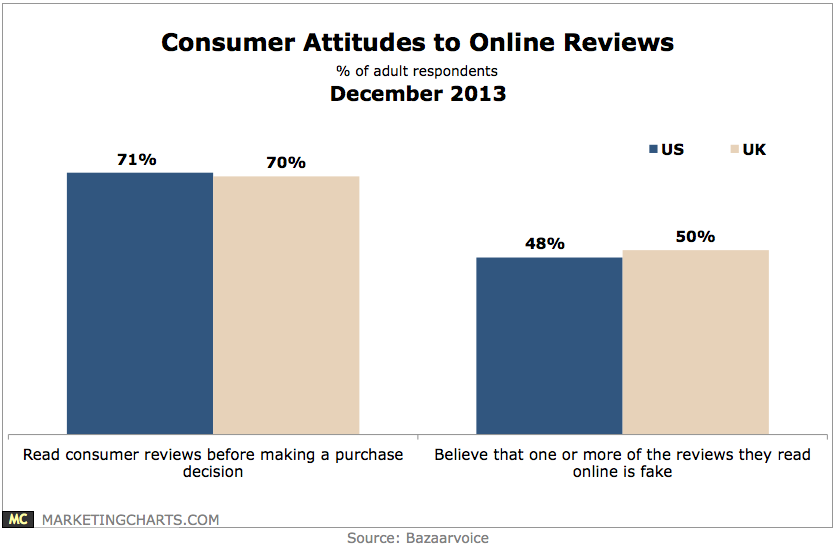
7 in 10 adult consumers in the US and UK read consumer reviews before making purchase decisions.
Read MoreTop 10 Smart Phone Apps, October 2013 [CHART]
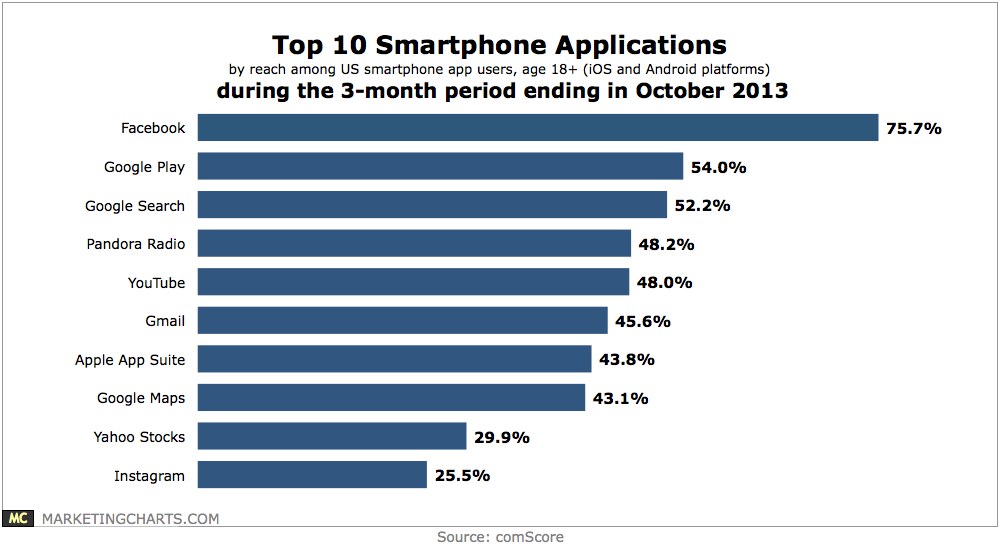
With 25.5% reach among adult iOS and Android app users, Instagram ranked as the 10th-largest smartphone application during the 3-month period ending in October 2013.
Read MoreGlobal Social Media Ad Spending By Region, 2012-2015 [TABLE]
Social media ad spending will approach 12% in the US in 2014, and nearly 9% worldwide.
Read MoreShare Of Average Time Spent Per Day On Select Online Activities, 2010-2013 [TABLE]
Fragmented multiscreen media consumption has left marketers struggling to keep up or get a word in edgewise.
Read MoreSocial TV Behavior, Q1-Q3 2013 [CHART]
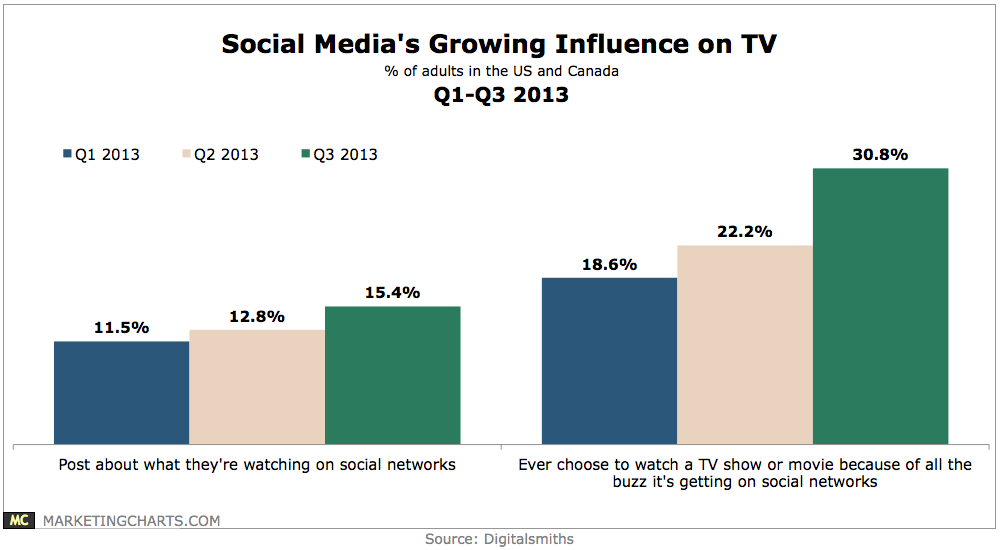
During Q3, 15.4% of adult respondents in the US and Canada claimed to post about what they’re watching, up from 12.8% in Q2 and 11.5% in Q1.
Read More