Social Media Marketing
Happy eCommerce Customers [INFOGRAPHIC]
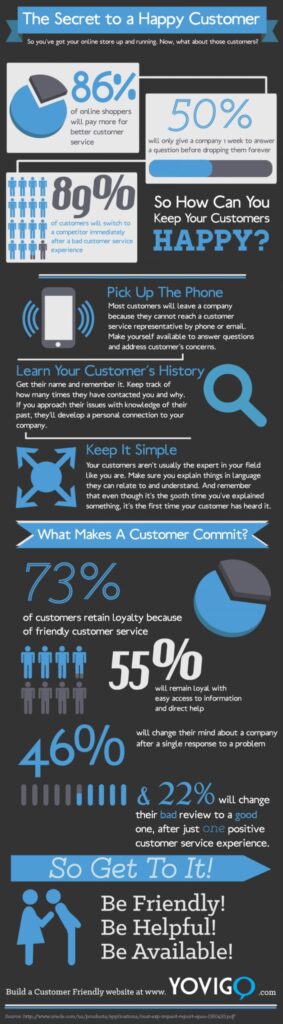
This infographic by Yovigo illustrates what makes eCommerce customers happy.
Read MoreConsumers' Interest In Sharing Brand Information, February 2014 [CHART]
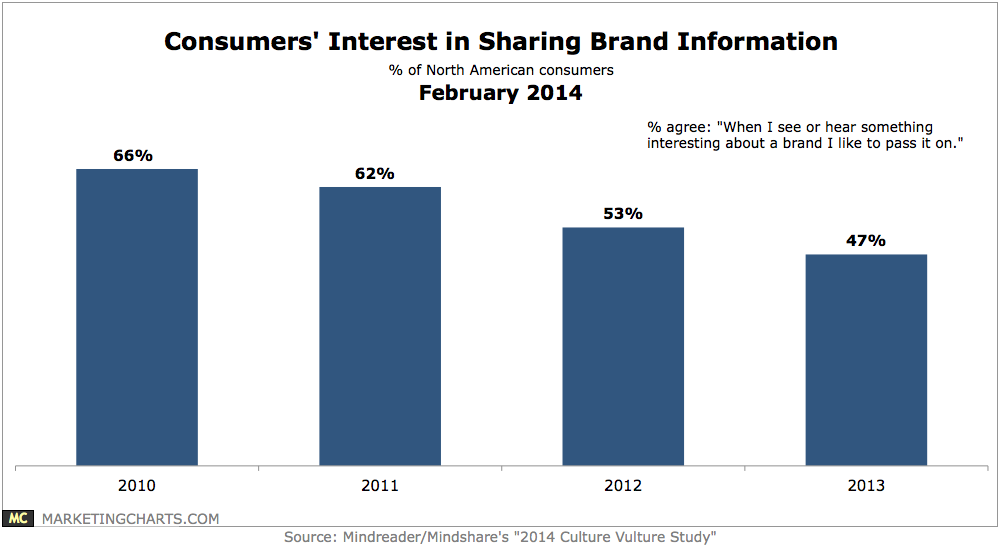
Only 47% of North American consumers last year agreed that they like to pass on interesting things they see or hear about brands, with that figure having steadily fallen over the past few years, from 66% in 2010.
Read MoreMonthly Time Spent On Social Networks, July 2013 [TABLE]
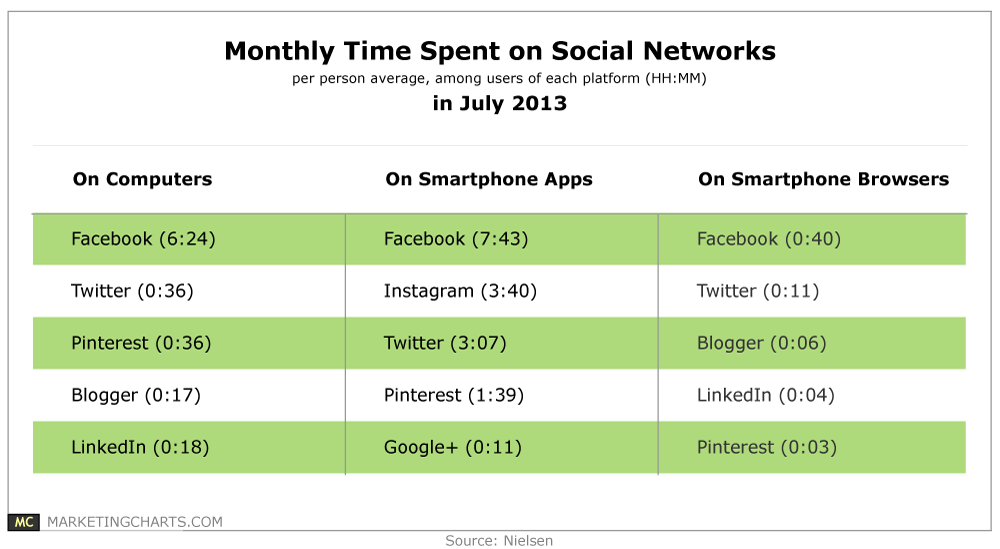
Among smartphone app users in July 2013, Instagram users were spending more time per person per month on the platform (3 hours and 40 minutes) than Twitter users (3 hours and 7 minutes).
Read MoreSMBs Use Of Social Media, February 2014 [TABLE]
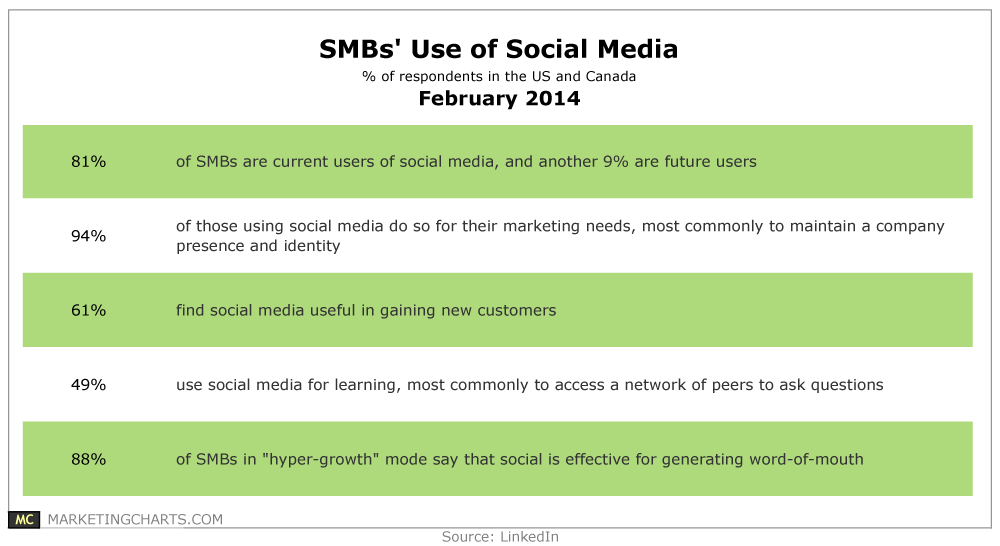
8 in 10 SMBs currently use social for their business, with the vast majority – 94% – of those doing so for their marketing needs.
Read MoreUSA Today 2014 Super Bowl Ad Ratings [INFOGRAPHIC]
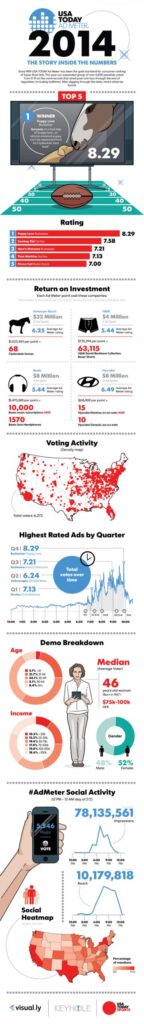
This infographic by USA Today illustrates the top commercials for the 2014 Super Bowl and their return on investment.
Read MoreGlobal Traveler, 2014 [INFOGRAPHIC]
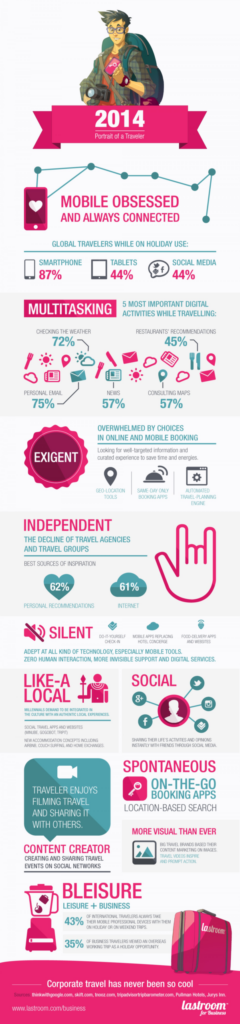
This infographic from LastRoom paints a picture of the behavior of the global traveler of 2014.
Read MoreHow To Curate Instagram Photos [VIDEO]

NowThisNews has a simple and clever way to curate their users’ photos on Instagram,.
Read MoreSocial Media Users In 2013 By Network [INFOGRAPHIC]
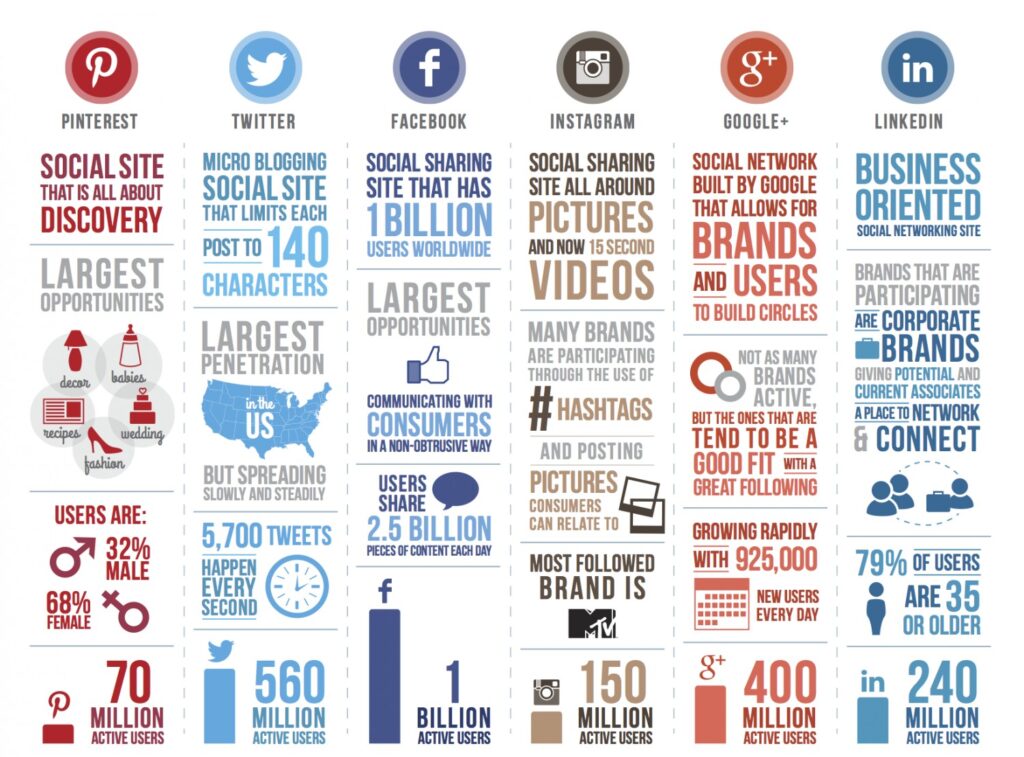
This infographic by Mark Taylor illustrates 2013 statistics for Pinterest, Twitter, Facebook, Instagram, Google+ and LinkedIn.
Read MoreWhere Millennials Make Purchases After Seeing Products On Social Sites, Fall 2013 [CHART]
Nearly eight in 10 millennial internet users who made a purchase after seeing an item on Facebook shopped both online and in-store.
Read MoreProduct Category Purchased By Millennials After Sharing On Social, Fall 2013 [TABLE]
US millennial internet users flocked to different social networks to post about different types of products they wanted to buy.
Read More