Photo Marketing
Always-On Consumers By Channel Use, February 2014 [CHART]
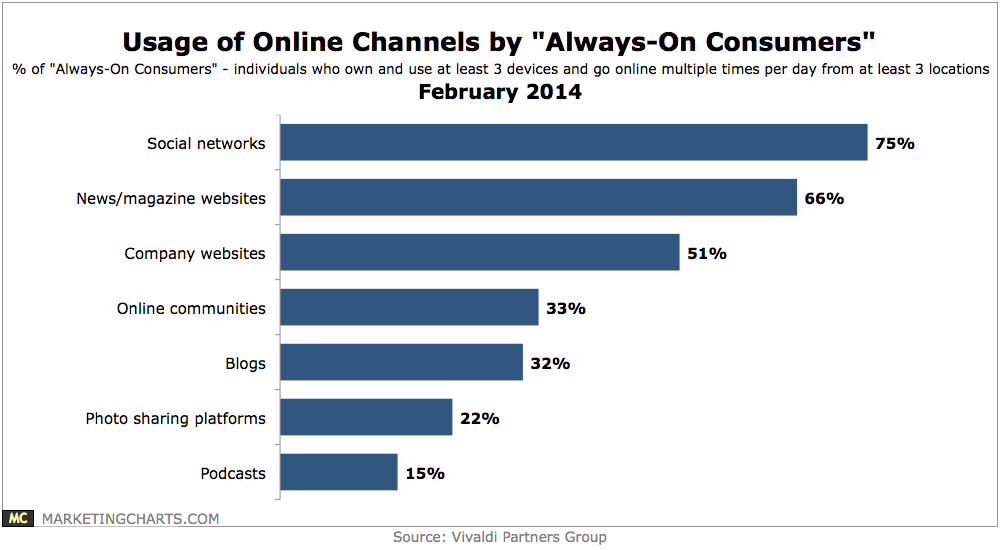
3 in 4 Always-On Consumers visit social networks, while two-thirds frequent news and magazine websites and half visit company websites.
Read MoreMonthly Time Spent On Social Networks, July 2013 [TABLE]
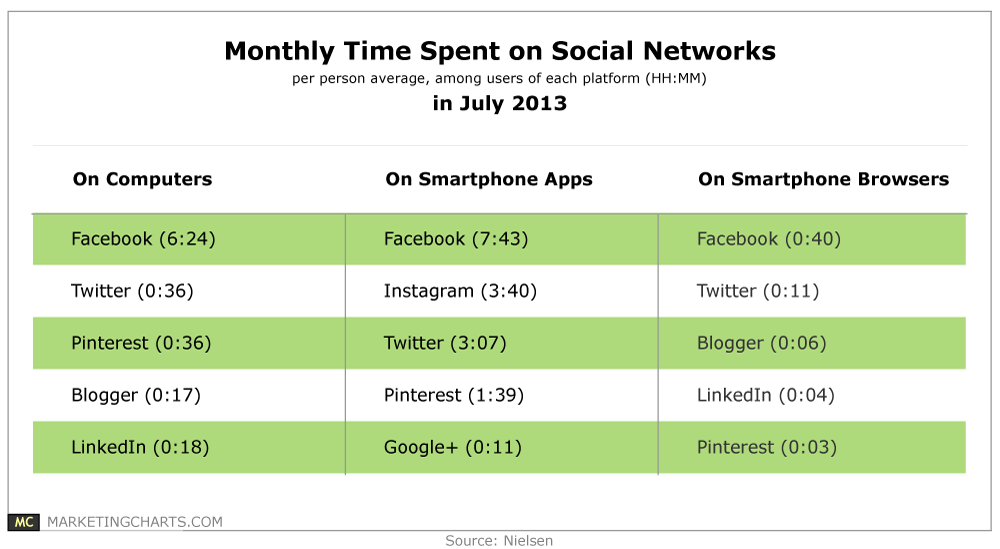
Among smartphone app users in July 2013, Instagram users were spending more time per person per month on the platform (3 hours and 40 minutes) than Twitter users (3 hours and 7 minutes).
Read MoreGlobal Traveler, 2014 [INFOGRAPHIC]
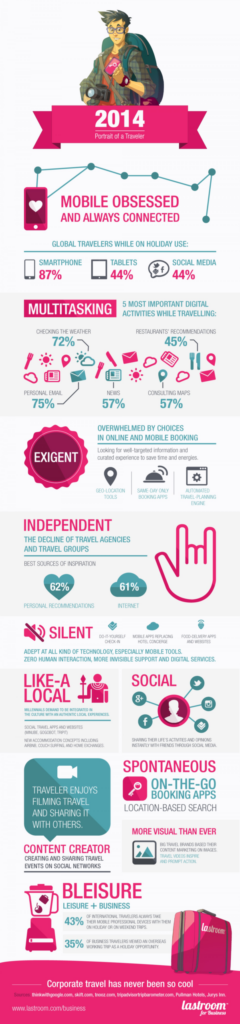
This infographic from LastRoom paints a picture of the behavior of the global traveler of 2014.
Read MoreSocial Media Users In 2013 By Network [INFOGRAPHIC]
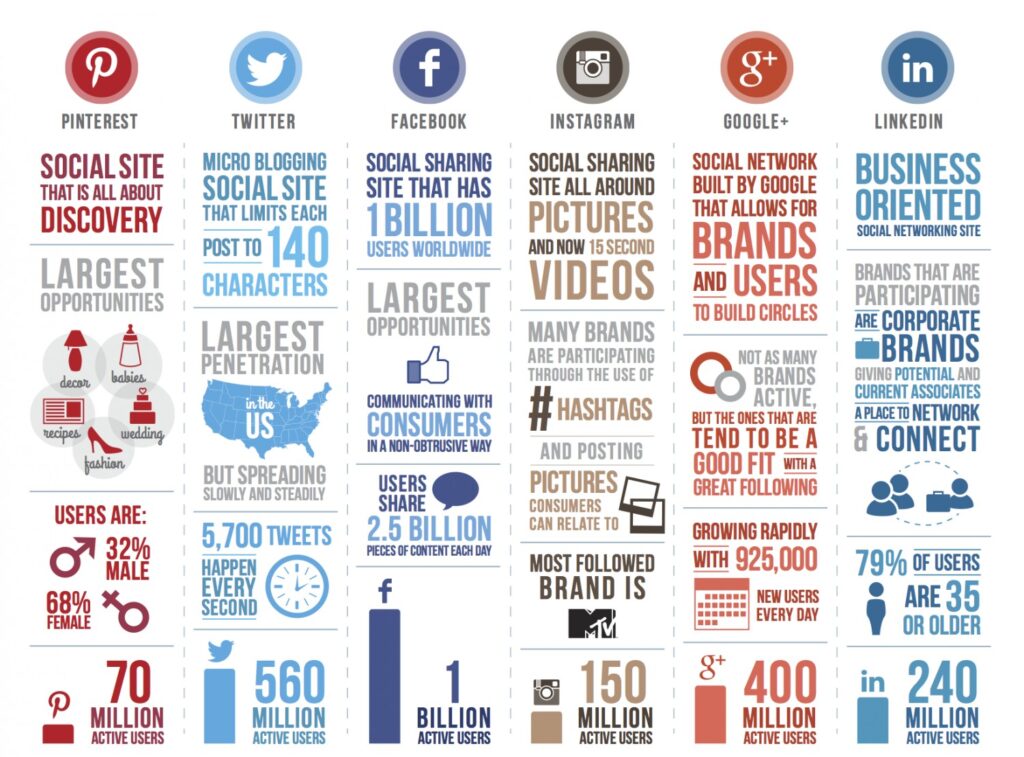
This infographic by Mark Taylor illustrates 2013 statistics for Pinterest, Twitter, Facebook, Instagram, Google+ and LinkedIn.
Read MoreWhere Millennials Make Purchases After Seeing Products On Social Sites, Fall 2013 [CHART]
Nearly eight in 10 millennial internet users who made a purchase after seeing an item on Facebook shopped both online and in-store.
Read MoreProduct Category Purchased By Millennials After Sharing On Social, Fall 2013 [TABLE]
US millennial internet users flocked to different social networks to post about different types of products they wanted to buy.
Read MoreMost Important Information On Local Biz Websites, February 2014 [CHART]
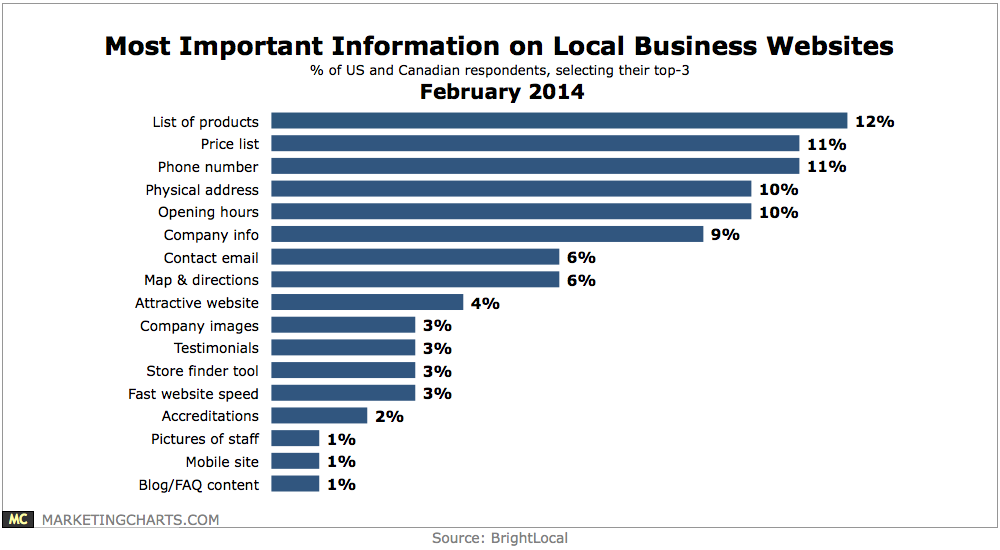
2 in 3 American and Canadian consumers indicate that a local business having a website affects their opinion of the business and whether or not to use it.
Read MoreSocial Networks That Brands Promote In Their Emails, 2012 vs 2013 [CHART]
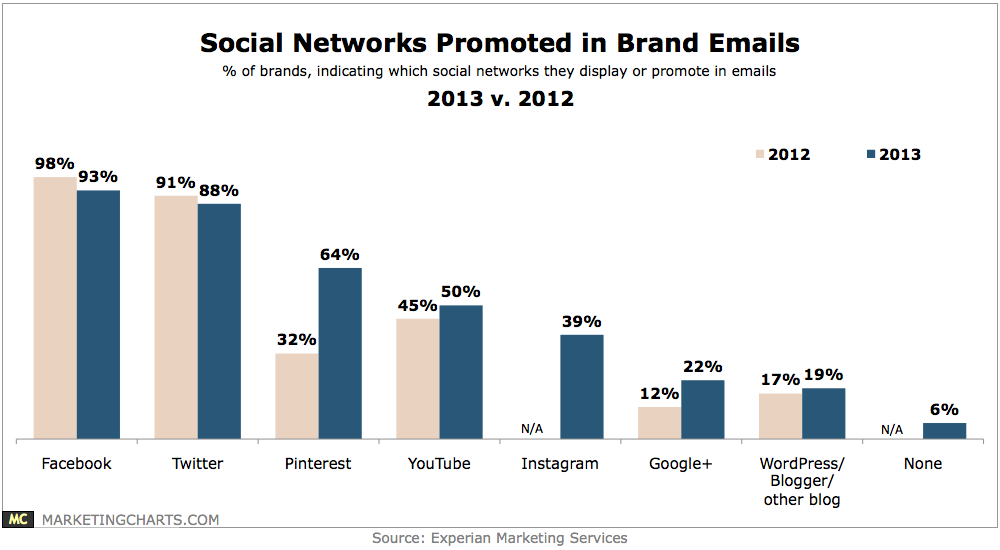
Some 94% of brands display or promote social networks in their email marketing efforts.
Read MoreNetworks Use By Mid-Sized Companies For Cross-Posting On Twitter, Q4 2013 [CHART]
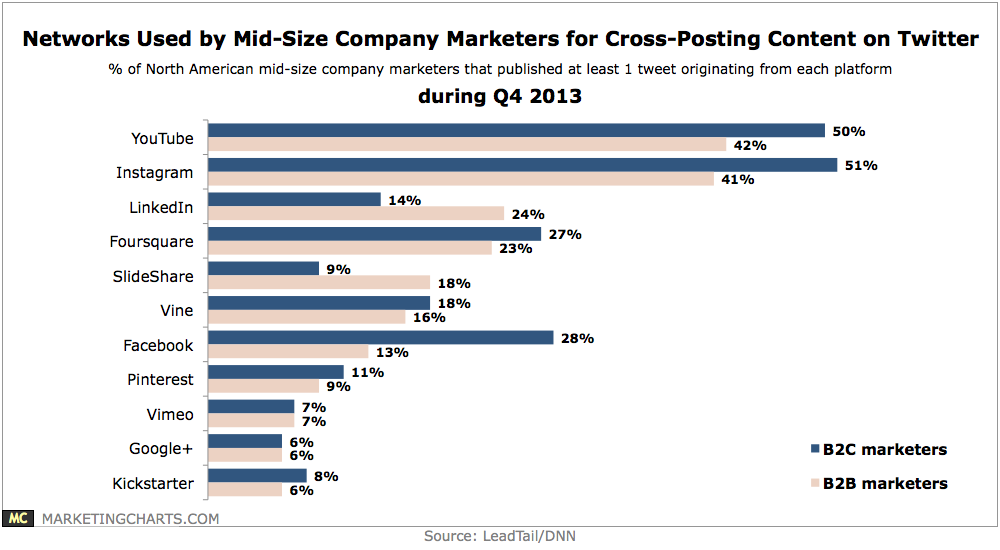
B2C and B2B marketers are using various social networks to different degrees to share content on Twitter.
Read MoreUS Penetration Among Select Social Networks During November 2013 [CHART]
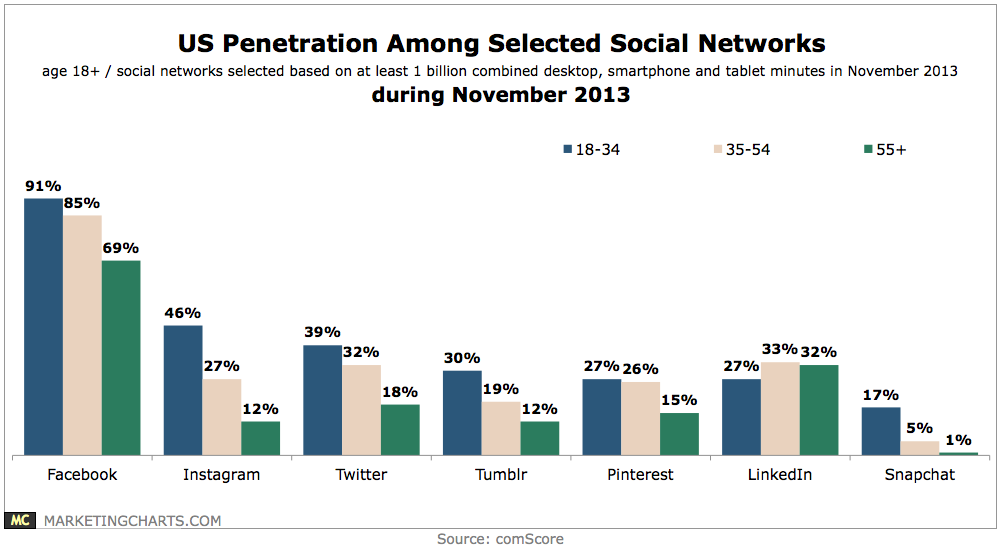
Some 17% of Millennials (18-34) use Snapchat on a monthly basis.
Read More