Outdoor Advertising
US Outdoor Advertising Growth, Q2 2011-Q2 2012 [CHART]
US out-of-home (OOH) ad expenditures rose 4.3% year-over-year in Q2 2012 to reach $2.05 billion.
Read MoreLocal vs. National Canadian Ad Spending By Channel, 2011 & 2016 [CHART]
Borrell estimates that national spending will decline by 12.9% from 2011 to 2016, with the biggest drops in network TV and directory spending at 41.9% and 41.4%, respectively.
Read MoreAd Spending Growth Rates In The UK By Category [TABLE]
Digital ad spending will exceed £5.3 billion in 2012 and is expected to reach £6 billion in 2013, representing 14.2% and 10.9% year-over-year increases.
Read MoreTV Advertising Influence Wanes With Age [CHART]
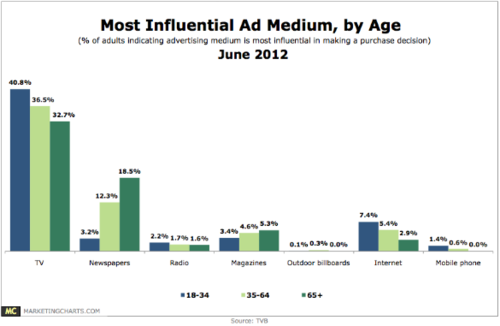
via marketingcharts.com Data from TVB’s “Media Comparisons 2012″ indicates that a plurality of respondents across all age groups believe that TV influences their purchase decisions the most. Interestingly, 18-34-year-olds are the most likely to report this (40.8%), with TV’s influence declining with age, to 36.5% of 35-64-year-olds and 32.7% of those aged 65 and older.…
Read MoreTV Most Influential Ad Medium For Purchases [CHART]
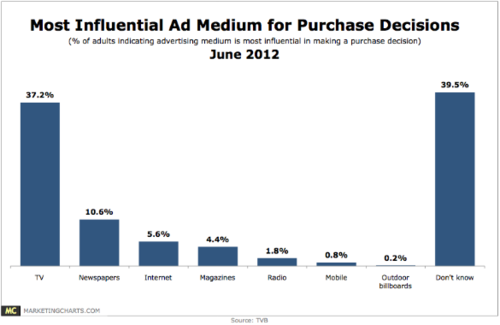
via marketingcharts.com When it comes to the advertising medium they find most influential in making a purchase decision, American adults are far more likely to point to TV (37.2%) than any other, including newspapers (10.6%), the internet (5.6%), and magazines (4.4%), per results from a TVB study released in June 2012. This result aligns with…
Read MoreUS Political Ad Spending By Media, 2008 & 2012 [CHART]
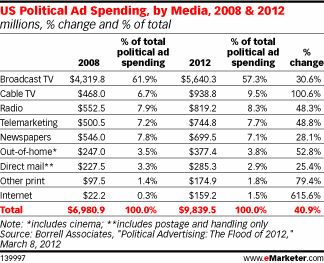
via emarketer.com Research firm Borrell Associates in March estimated that US political ad spending on the internet would total $159.2 million this year, thanks to all of the attention being paid to the presidential race. While that figure represents only 1.5% of total political ad spending this year, it’s also a massive 617% increase from…
Read More


