Online Behavior
Global Wearable Shipments, 2014-2020 [TABLE]

Estimates for 2014 wearables shipments made by multiple firms showed a gap of 10 million units between the most conservative and most aggressive projections.
Read MoreFrequency Of On-Screen TV App Use, November 2014 [CHART]
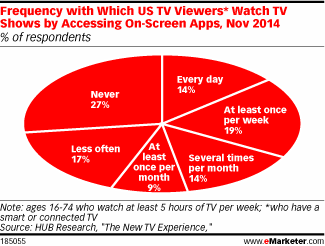
The installed base of US connected TVs was at 22 million in Q4 2014, up from 13 million in Q4 2013.
Read MoreFrequency Of Prestige Brand Instagram Posts & Engagement, Q4 2013-Q4 2014 [TABLE]
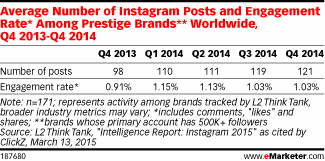
Instagram presents brands with an audience that’s enthusiastic about engagement.
Read MoreBrand Adoption Of Instagram By Industry, Q1 2015 [CHART]
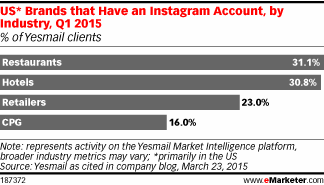
Brand Adoption of Instagram: Just 23% of US brands had an account on Instagram.
Read MoreTeen Access To Consumer Electronic Devices, April 2015 [TABLE]
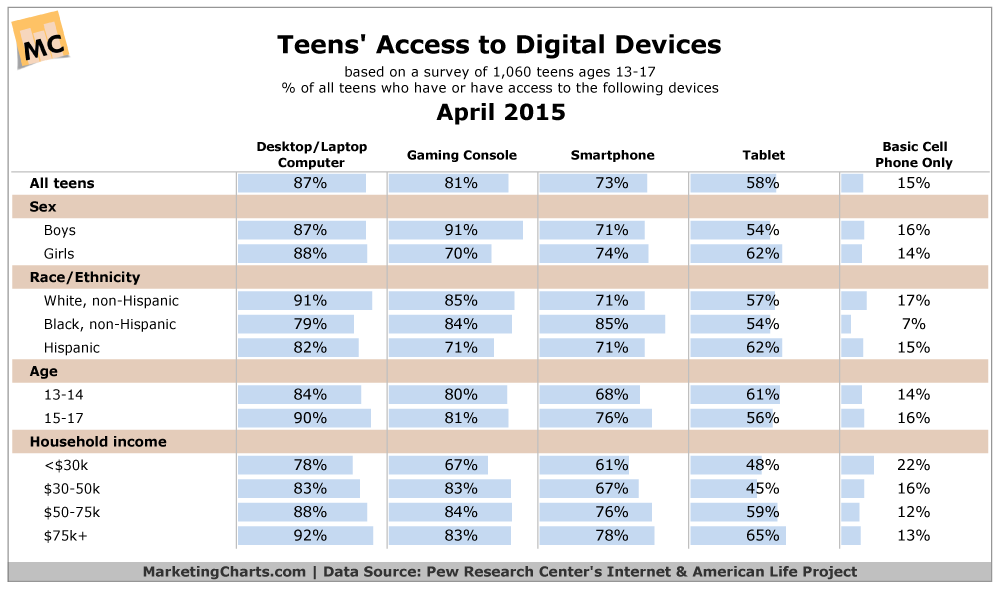
Some 87% of teens aged 13-17 own or have access to a desktop or laptop computer, while 81% have access to a gaming console.
Read MoreFinancial Services Customer Experience Channel Priorities, April 2015 [CHART]

Public desktop websites are a greater priority than smartphone apps or public mobile sites when it comes to providing a consistent customer experience.
Read MoreSocial Login Trends, 2012-2015 [CHART]
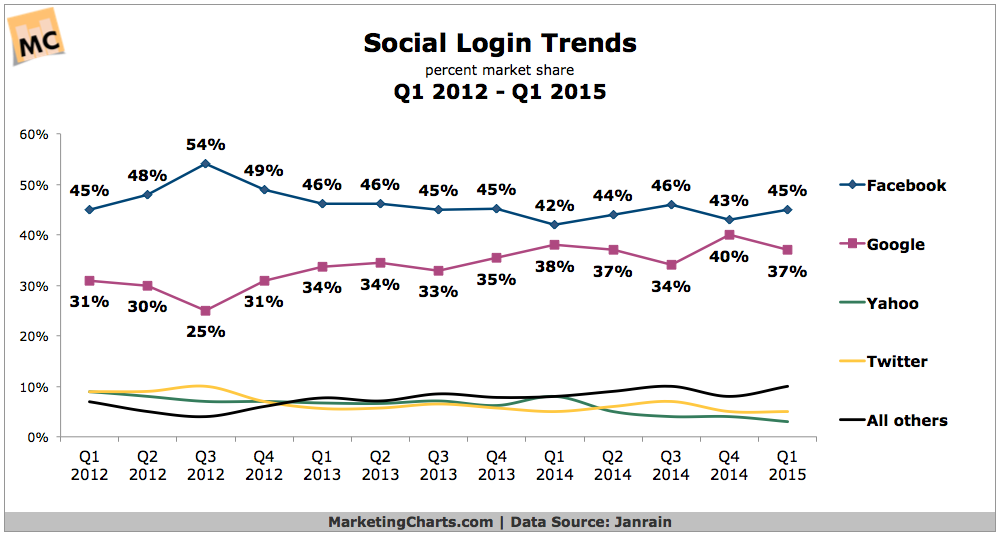
Facebook, which in Q4 2014 looked in danger of surrendering its lead in social logins to Google, has widened the gap again in Q1.
Read MoreHow Millennials Use Facebook For News, February 2015 [CHART]
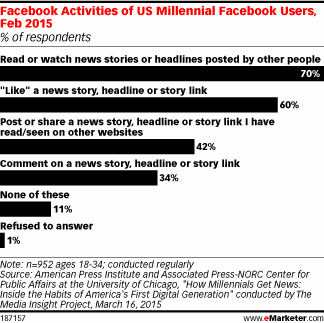
Seven in 10 Millennials said they regularly read or watched news stories and headlines posted by other people on Facebook.
Read MoreFrequency With Which Millennials Check Social For News [TABLE]
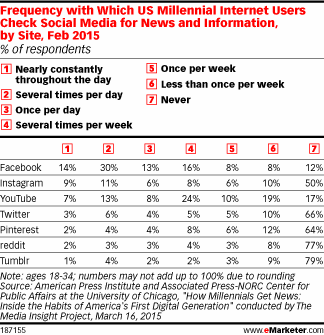
57% of US millennials checked Facebook at least once a day to get news and information.
Read MoreWhy Journalists Use Twitter & Facebook, January 2015 [CHART]
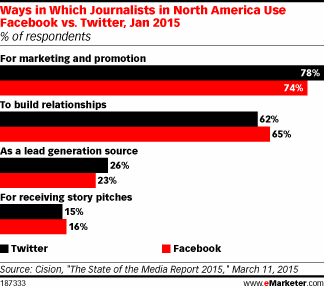
Individual reporters are making themselves known on Twitter and Facebook.
Read More