Online Behavior
Facebook Post Reaction Share By Type [CHART]
The lion’s share (97.0% ) of Facebook post reactions consist of Likes.
Read MoreMobile Commerce [INFOGRAPHIC]

This infographic illustrates the mCommerce market, from rising regions, to average order value, to mobile coupon use and payments.
Read MoreSimultaneous Internet & TV Users, 2014-2018 [TABLE]
This year, 182.9 million Americans will use the internet while watching TV at least once a month.
Read MoreAttitudes Toward Political TV & Online Ads [CHART]
The presidential campaigns have had the most variation in ads served.
Read MorePolitical Ad Impressions By Device & Campaign Type [CHART]
Desktop video ads have made up the bulk of each campaign’s approach. Local campaigns concentrated on this format the most since the beginning of 2015.
Read MoreTypes Of Online Harassment [INFOGRAPHIC]
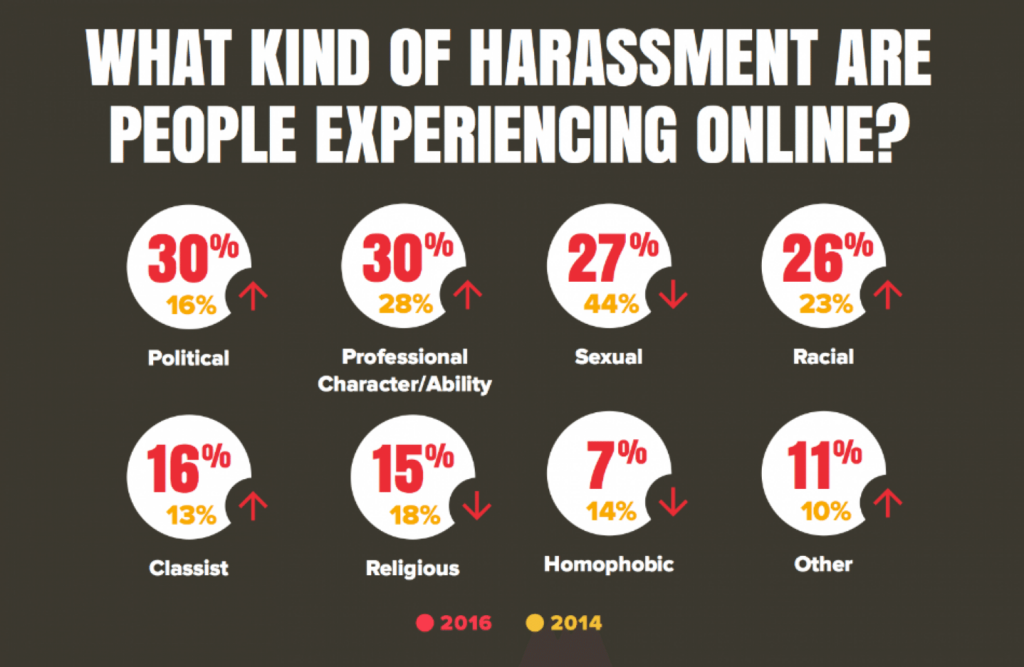
95 percent of all Americans consider incivility a problem. Seventy percent consider it a crisis, which is up from 65 percent in 2014.
Read MoreUS Coupon Use By Type & Generation [CHART]
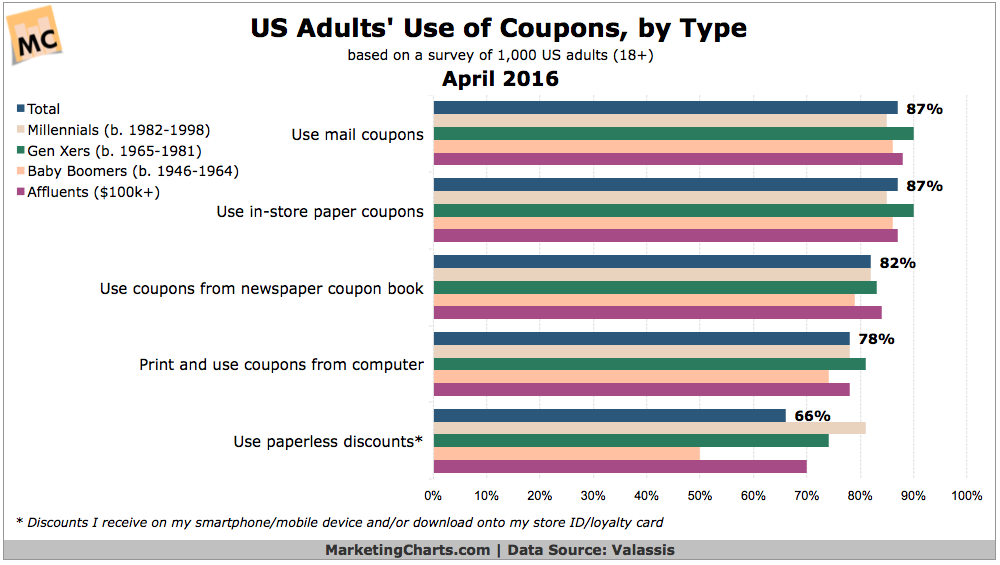
US adults are more likely to use print coupons than paperless discounts, a finding that is true across generations and extends to affluents.
Read MoreMultitainment Behavior By Generation [CHART]
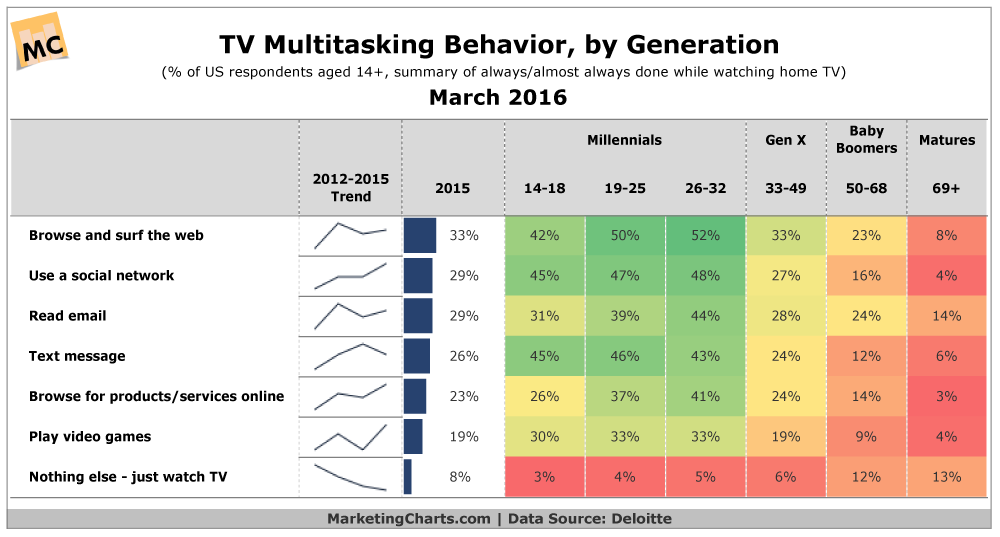
More than 9 in 10 US consumers aged 14 and older say they typically multitask while watching TV, up from about 8 in 10 just 3 years earlier.
Read MoreTop Purchase Influences By Generation [CHART]
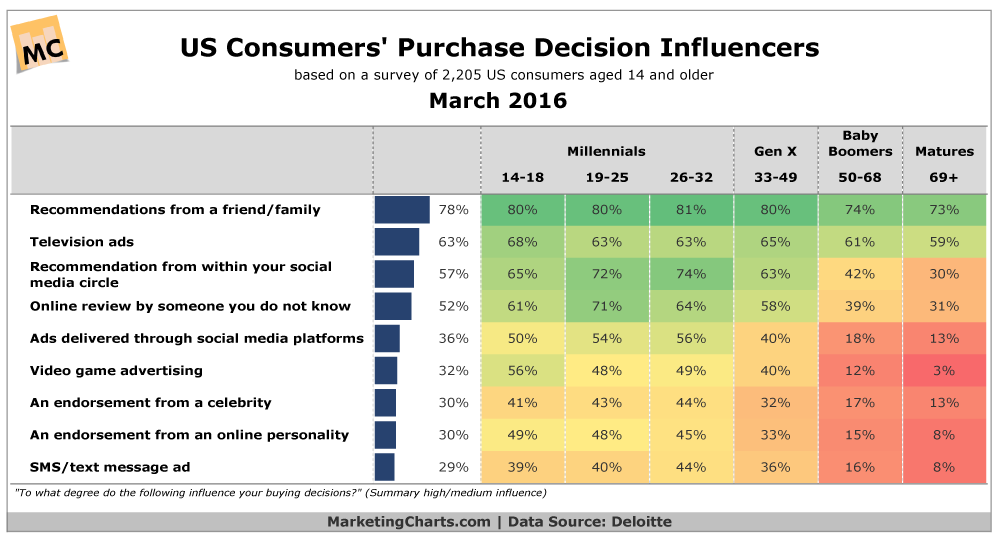
Word-of-mouth influences the purchases of more US consumers than TV ads, a finding that holds true across generations.
Read MoreConsumers' Preferred Brand Communication Channel [CHART]
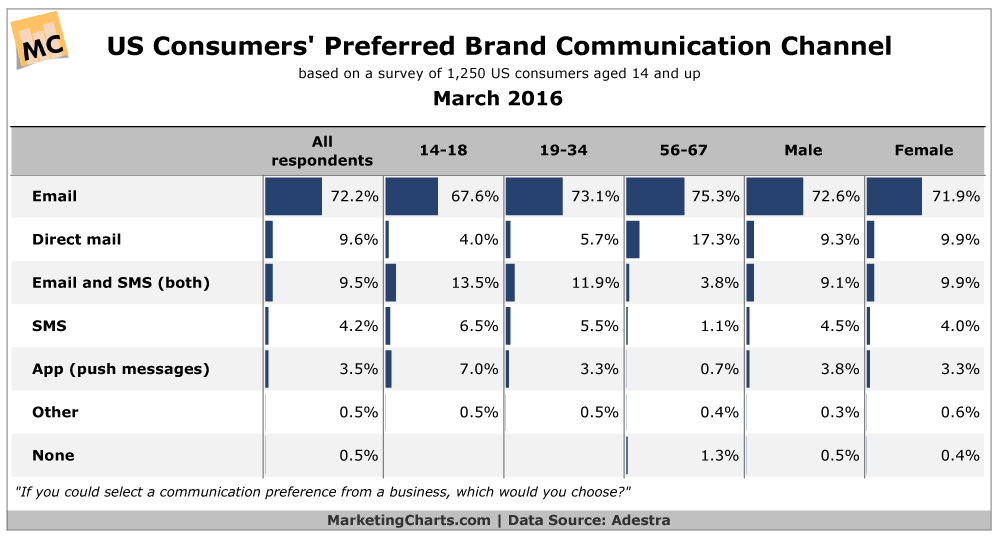
More than 7 in 10 US consumers would prefer to receive email communications from businesses.
Read More