Online Behavior
News Audience Trends, 2011 vs 2012 [CHART]
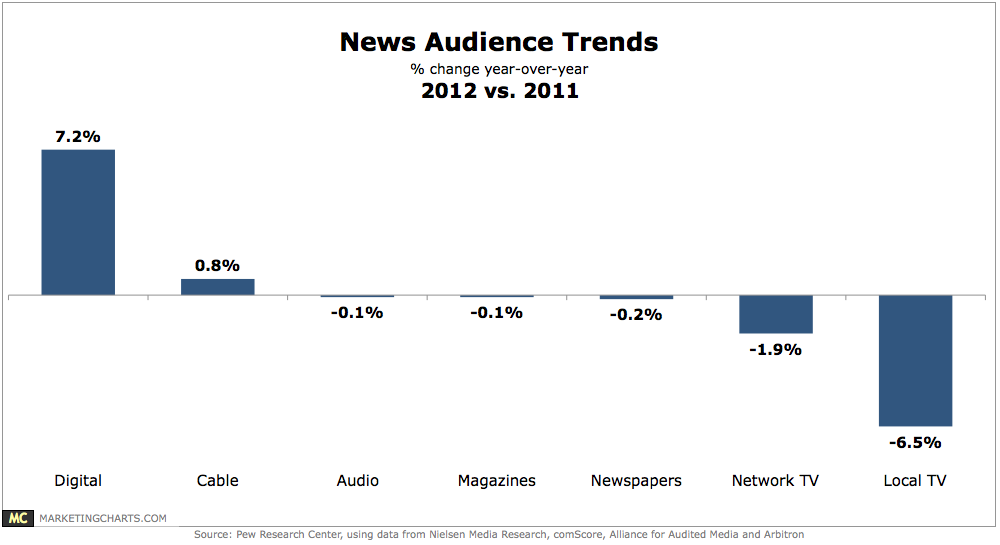
Local TV saw a significant 6.5% drop in audience size between 2011 and 2012, finds Pew Research Center’s Project for Excellence in Journalism in its State of the News Media 2013 study.
Read MoreTop Desired Health Care Website Features, February 2012 [CHART]
53% of health seekers would use a health care site that offered them a tool to tell them how much a health plan would pay for certain treatments or services.
Read MoreOnline Health & Wellness Researchers, 2010-2012 [CHART]
87% of US internet users looked online for health and wellness research in 2012.
Read MoreLuxury Shoppers mCommerce Activities, 2011 & 2012 [CHART]
Mobile shopping activity among affluent luxury shoppers in the US saw substantial increases in 2012; the percentage of respondents shopping or purchasing via mobile increased from 22% to 38%.
Read MoreWhere People Mobile Shop, October 2012 [CHART]
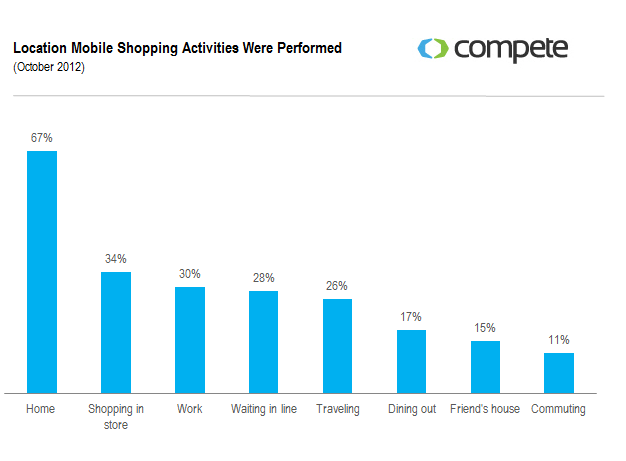
Nearly 1 in 5 consumers performs shopping activities on their phone while dining out.
Read MoreActivities Performed On Computers vs. Tablets vs. Smart Phones [CHART]
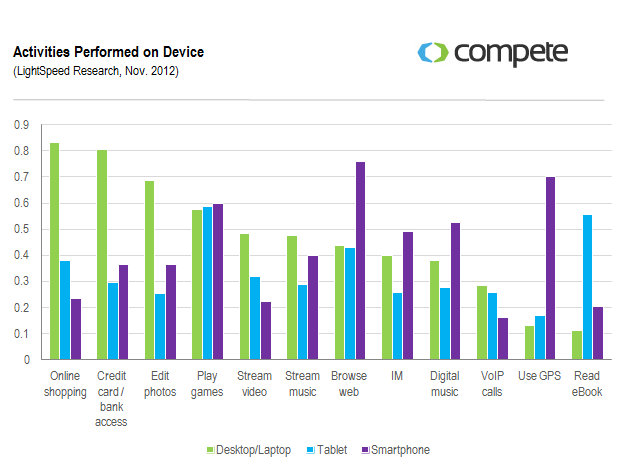
45% of consumers who use their mobile devices to shop report using the device to compare prices.
Read MoreConsumer Behavior & Mobile Marketing [INFOGRAPHIC]
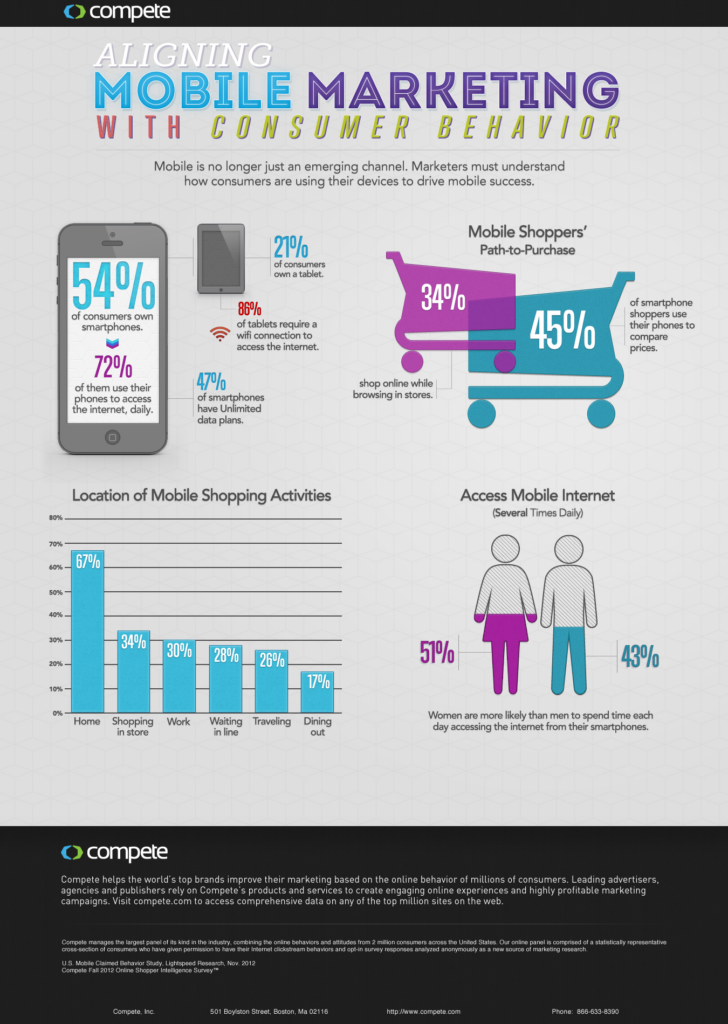
This infographic from LightSpeed Research suggests that mobile should no longer be thought of as an emerging channel for consumers.
Read MoreWeekly Ads Drive Retailer Website Traffic: Walmart vs. Target [CHART]
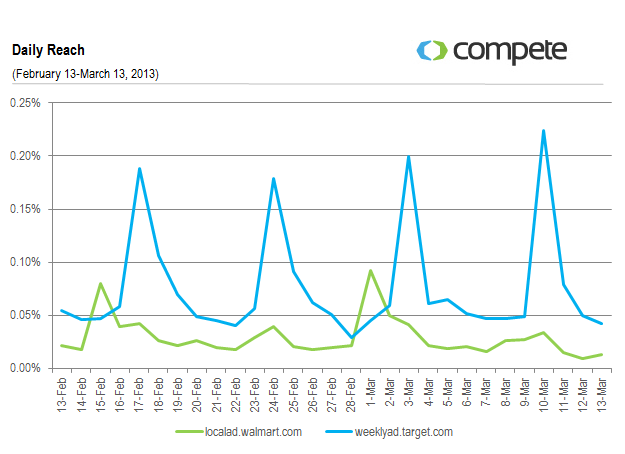
On the release of the weekly ad, traffic spikes for Walmart and Target.
Read MoreEffectiveness Of Job Seeking Using Facebook By Strength Of Connection [CHART]
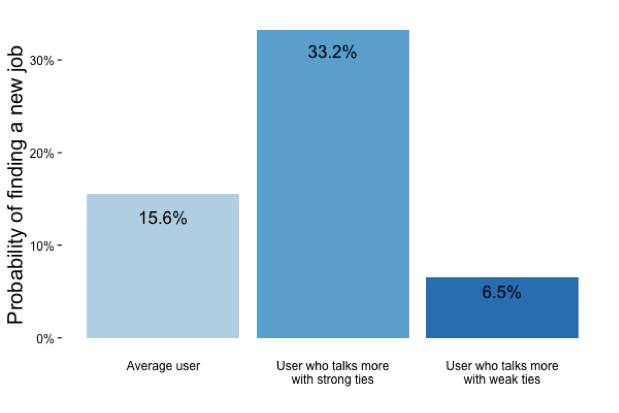
Facebook users who talked more with close friends regarding job hunts and job opportunities were much more likely to find employment than those who tended to reach out to acquaintances.
Read MoreConsumer Reactions To Poor Mobile App Experiences, March 2013 [CHART]
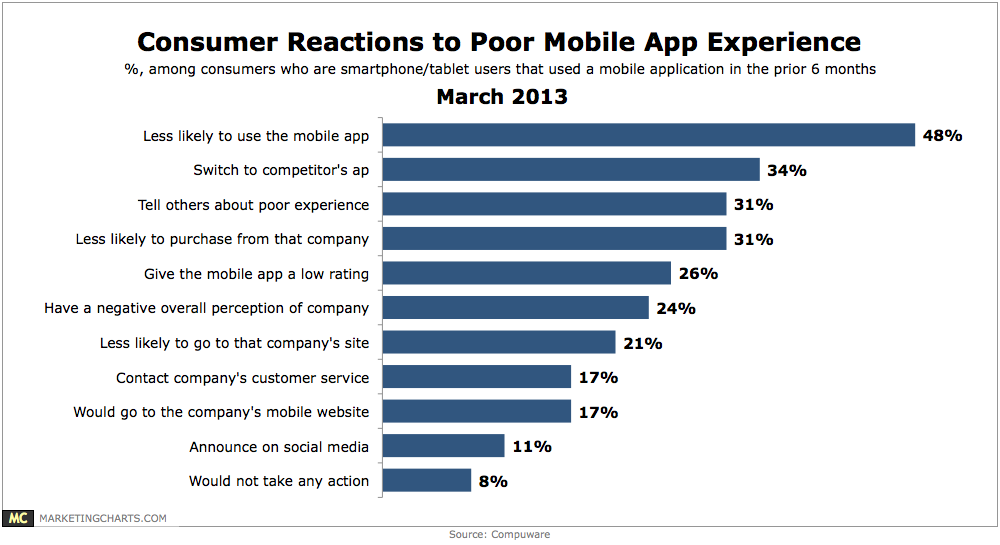
56% of mobile application users report having encountered a problem (crash, freeze, error, etc.) when accessing an app.
Read More