Online Behavior
Facebook Ad Performance Trends, Q4 2013 [CHART]
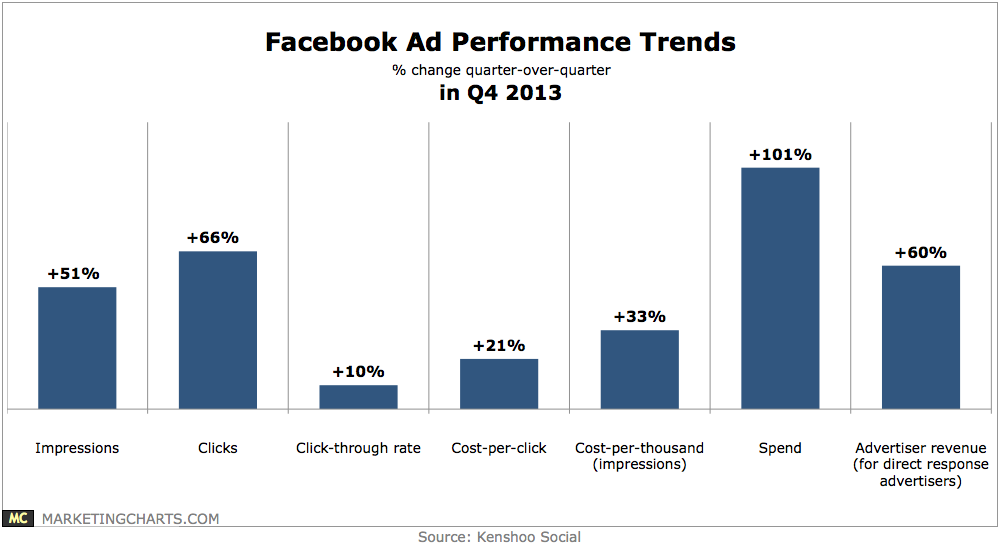
Facebook ad click-through rates grew by 10% quarter-over-quarter (Q-o-Q) in Q4.
Read MoreSocial Search [INFOGRAPHIC]
This infographic by Prestige Marketing illustrates some trends in social search.
Read MoreA Year In Vines [PRESENTATION]
A retrospective of Vine’s first year.
Read MoreMost Popular Marketing Agency Blog Content [CHART]
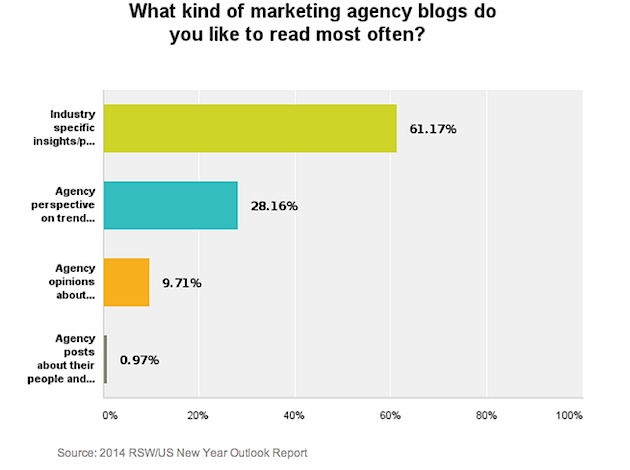
The blogs read most often are those that provide industry-specific insights.
Read MoreFrequency Of Marketing Agency Blog Readership [CHART]
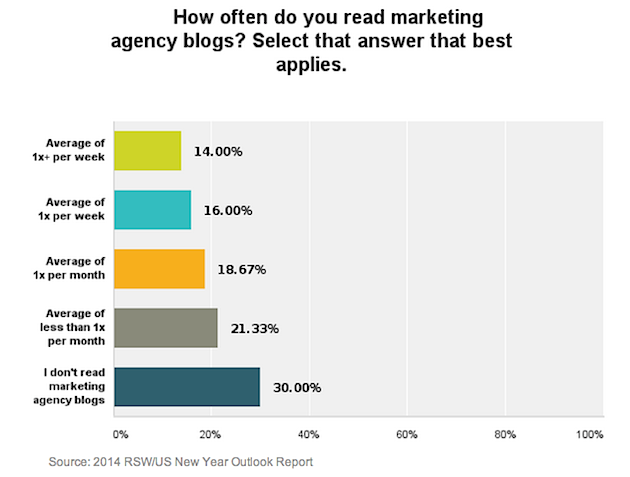
Nearly half of the marketers/prospective clients surveyed (49%) say that they are indeed reading agency blogs.
Read MoreFrequency Of Marketing Agency Blogging [CHART]
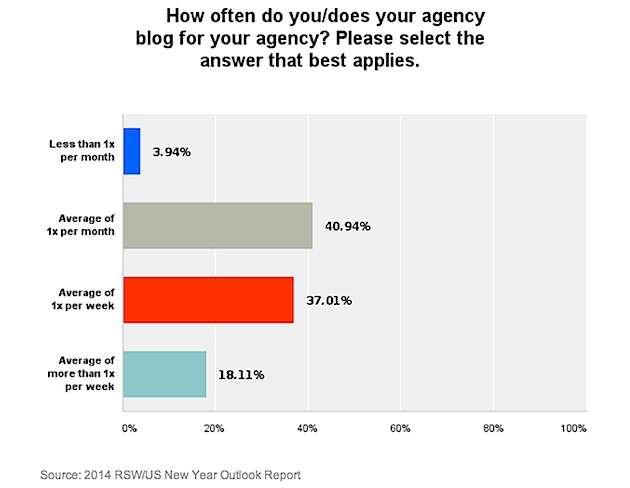
Just over three-quarters of agencies (76%) have an external-facing company blog, and 58% expect their blogging activity to increase in 2014,
Read MoreDaily Time Spent Online By Age, 2012 vs 2013 [CHART]
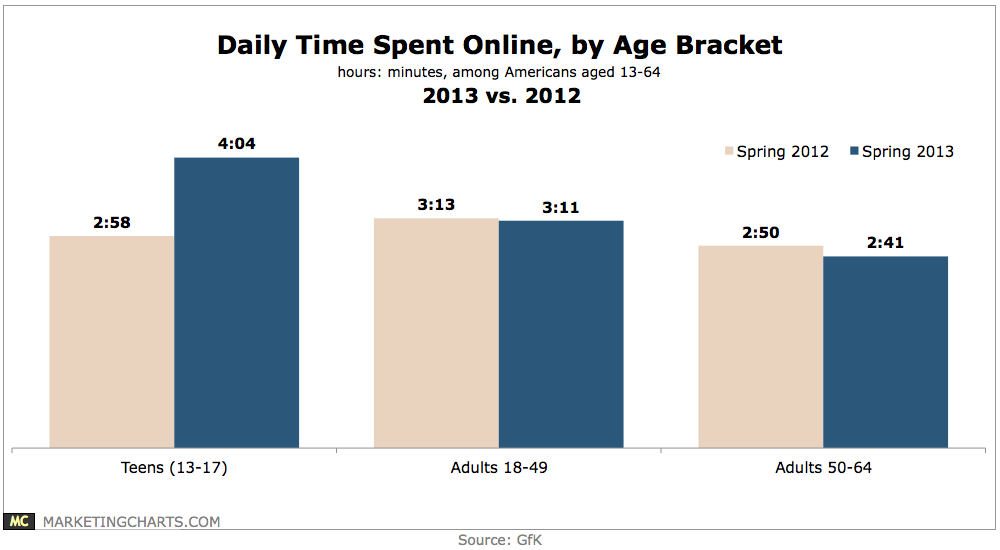
13-17-year-olds spent an average of 4 hours and 4 minutes per day online, a 37% hike from just under 3 hours per day a year earlier.
Read MoreDesktop-Only Social Network Visitors, 2013 [CHART]
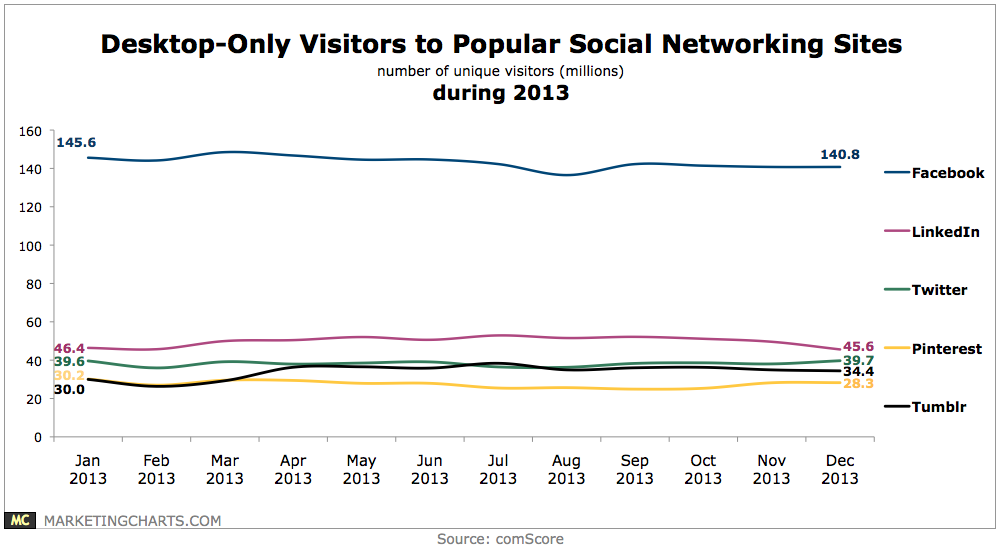
Facebook remains the leader in desktop-only visitors by a large margin, although its numbers appeared to dip slightly during the year.
Read MoreConsumer Attitudes Toward Personalized Shopping Experiences, January 2014 [TABLE]
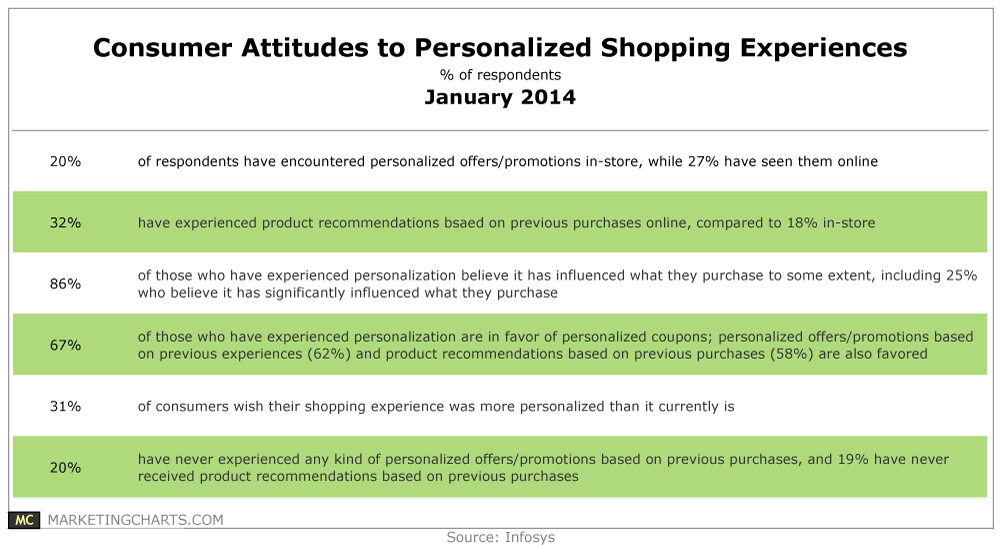
1 in 5 consumers say they have encountered personalized offers and promotions in-store, while 27% have seen them online.
Read MoreSpeed Up WordPress [INFOGRAPHIC]
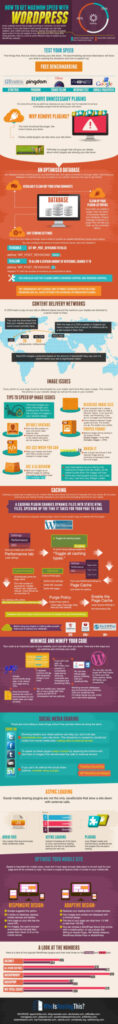
This infographic by WhoIsHostingThis illustrates methods for speeding up your WordPress blog.
Read More