Online Behavior
Conversion Rates With Forms Using A "Submit" Button [CHART]
Submit buttons actually labeled “submit” tended to have lower conversion rates than those that used other wording.
Read MoreUS vs UK Video Ad View Share By Device, Q1 2014 [CHART]
Tablets accounted for 17% of total digital video ad views (of ads served through the company’s network) in the UK in Q1 2014.
Read MoreFastest-Growing Social Apps, Q3 2013 – Q1 2014 [CHART]
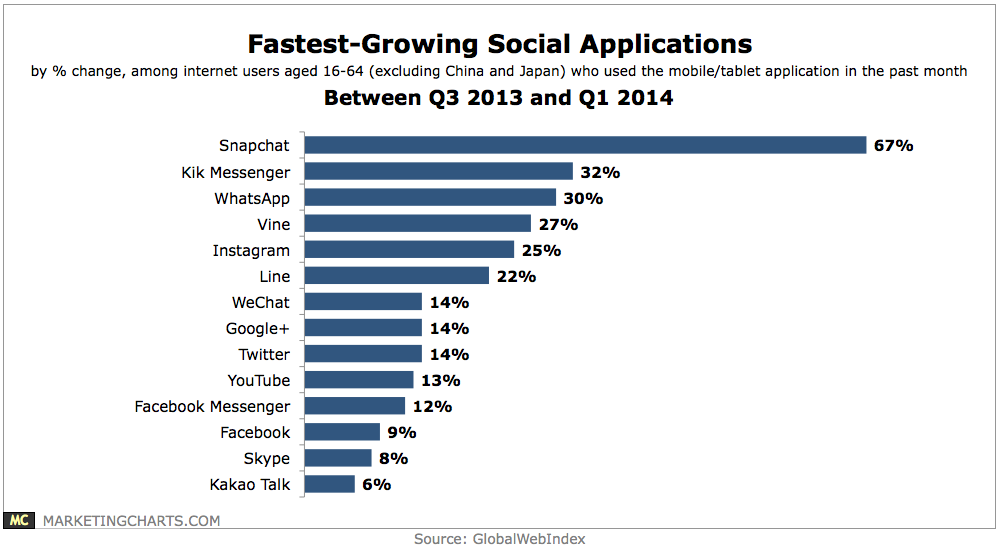
Snapchat ranks as the fastest-growing social application by a fair margin, with its number of users up 67% between Q3 2013 and Q1 2014 (+95% among 16-19-year-olds).
Read MoreAttitudes Toward TV Everywhere, May 2014 [TABLE]
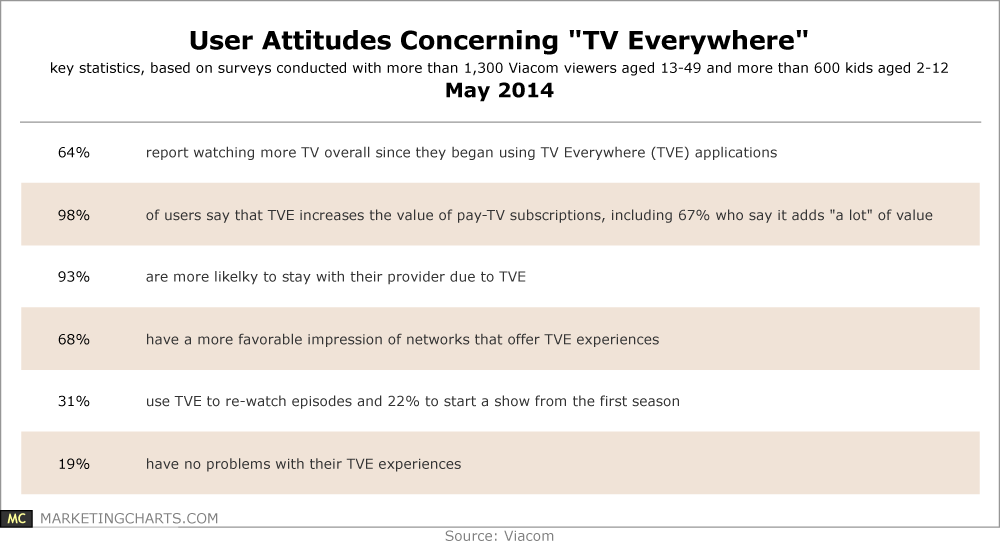
Almost two-thirds of respondents report watching more TV overall since they began using TVE applications.
Read MoreWebsite Personalization Adoption, May 2014 [CHART]
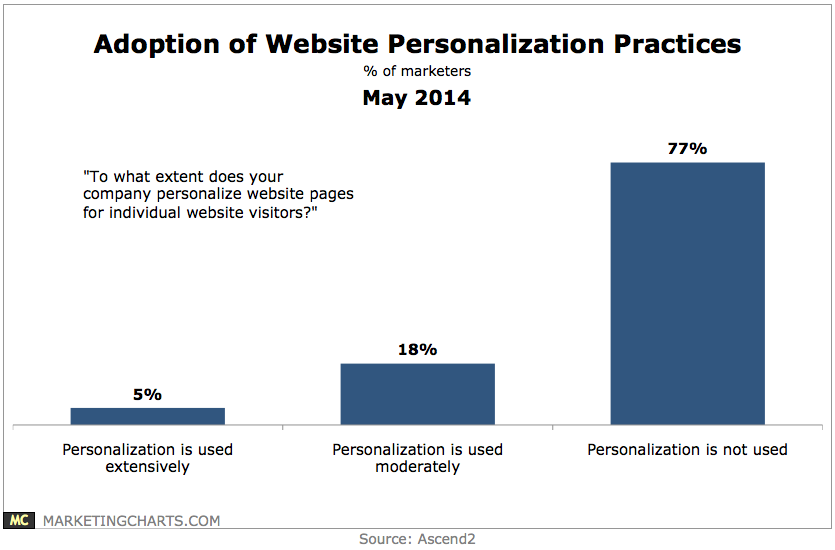
Only 5% said their companies are using personalization extensively, with an additional 18% reporting that personalization is being used moderately.
Read MoreConsumer Attitudes Toward Mobile Marketing, May 2014 [TABLE]
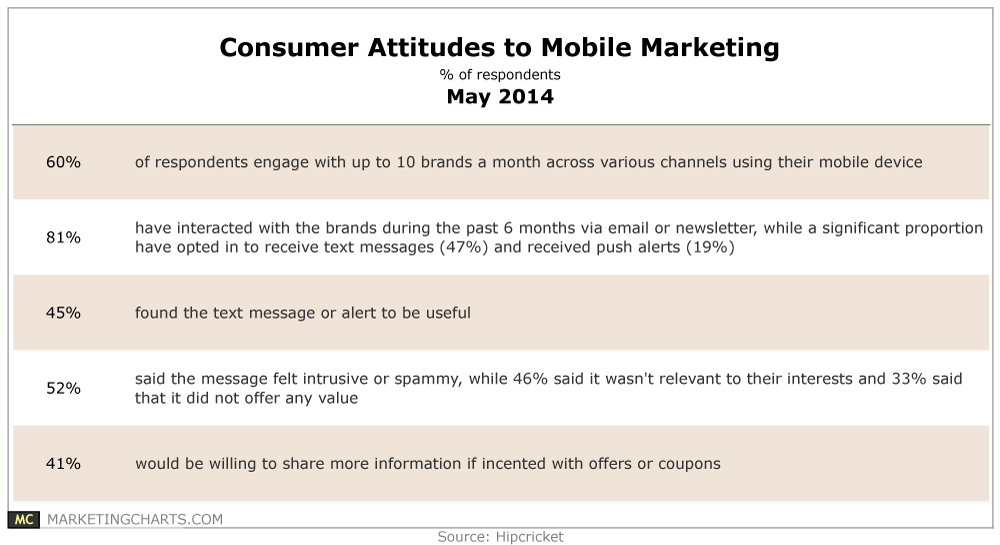
Some 6 in 10 respondents to a Hipcricket survey say they engage with up to 10 brands a month via their mobile devices.
Read MoreTime Investment In Social Media Marketing By Activity, May 2014 [CHART]
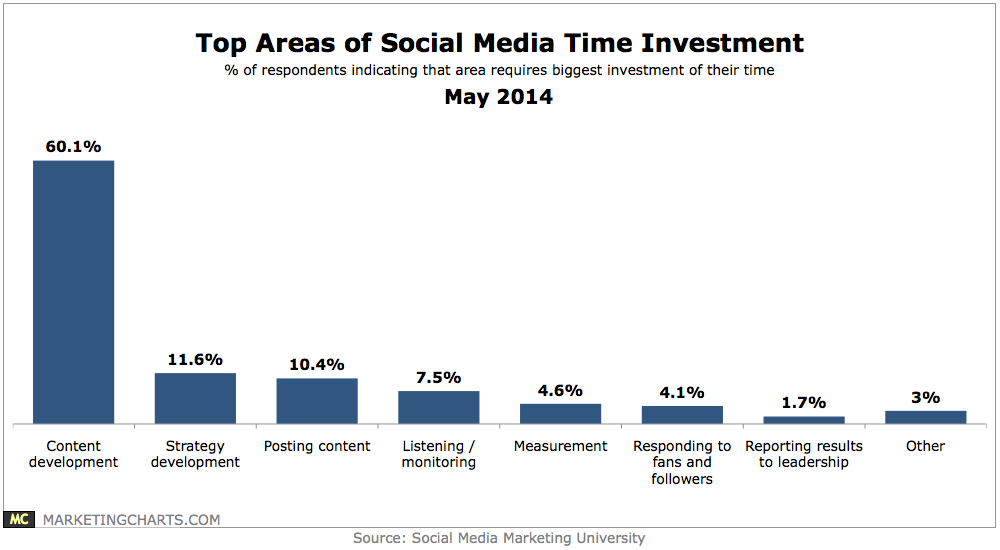
The largest share by far (60.1%) identified content development as the most time-intensive activity, an unsurprising result.
Read MoreSpeed Of Branded Video Sharing, 2013 vs 2014 [CHART]
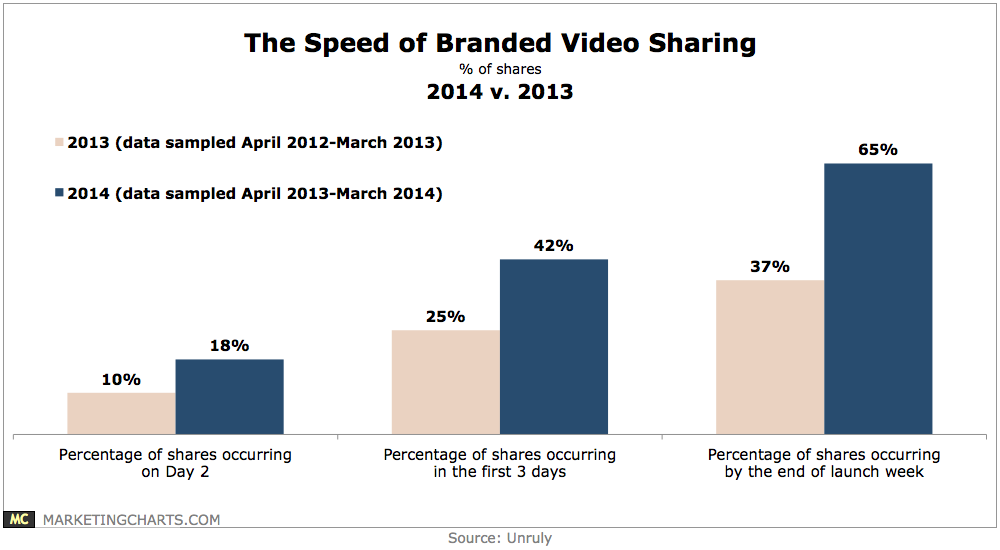
An average 42% of shares now occur during the first 3 days of launch, up from 25% last year.
Read MoreDaily Time Spent With Media Among Milllennial & Gen X UK Mothers, April 2014 [TABLE]
86% of UK millennial mother internet users owned a smartphone in 2014, while a further 70% owned a tablet.
Read MoreMillennial Mobile Mothers In Select Countries, 2013 [TABLE]
49.9% of mothers in Great Britain with kids ages 0 to 5 accessed the internet via a mobile device in 2013, vs. just 29.9% of Great Britain’s total population.
Read More