Online Behavior
Share Of Video Plays By Duration & Device, Q1 2014 [CHART]
Almost 90% of video plays on smartphones were less than 10 minutes in length, and roughly 80% of video plays on tablets were also short-form video.
Read MoreSmart Phone Owners Who Would Pay For World Cup Video [CHART]
More smartphone-toting World Cup followers in the UK were willing to pay for World Cup video content than in any other country polled.
Read MoreMost Important Types Of Apps For Booking Travel, March 2013 [CHART]

Travelers preferred app experiences over the mobile web.
Read MoreUS Mobile Travel Booking By Device, 2012-2018 [CHART]
eMarketer forecasts that nearly 26 million US consumers will book travel via such a device this year.
Read MoreMobile’s Share Of Email Opens By Daypart, H2 2013 [CHART]
Mobile’s share of email opens continues to increase, with various sources reporting that share to be 50% or higher.
Read MoreTop Reasons For Abandoning Shopping Carts, June 2014 [CHART]
The primary reasons given by online shoppers for abandoning a shopping cart were that: the shipping costs made the total purchase cost more than expected.
Read MoreAverage Time Spent Per Day By Device, 2010-2014 [TABLE]
In a marketing world driven ever more by data, content marketing remains very much an art form, especially in the business-to-consumer arena.
Read MoreSocial Channels Used To Follow Sports In Select Countries, February 2014 [TABLE]
Among US internet users who used social networks to follow sports, Facebook was the top platform used, cited by 70% of respondents—30 percentage points ahead of No. 2 YouTube.
Read MoreMultitainment Behavior Of World Cup Viewers [CHART]
Facebook tied with SMS for the top way US smartphone users following the FIFA World Cup planned to communicate with others about games while watching.
Read MoreTop Benefits Of Professional Content On LinkedIn, June 2014 [CHART]
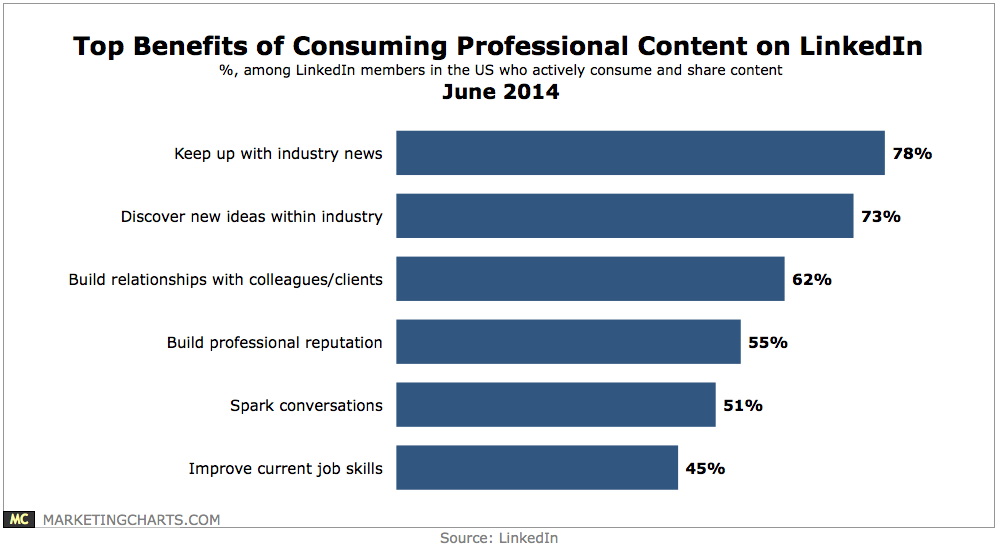
A leading 78% consume content in order to keep up with industry news, while 73% do so to discover new ideas within the industry.
Read More