Online Behavior
US Online Ad Revenue Share By Format, 2013-2014 [CHART]
Mobile ad spending comprises almost one-quarter (23%) of total online ad spend.
Read MoreConsumers Text Messaging With Brands, September 2014 [CHART]
2/3rds of respondents – who are aged 18-65 and hail from 12 markets – claimed to check their smartphone for new messages or activity at least every hour.
Read MoreSuspicious Web & Mobile Traffic, 2013-2014 [CHART]
Some good news on the bot traffic front, as levels of suspicious web activity dropped to 45% – still a high figure, but an improvement nonetheless from the high of 61% in Q4 2013.
Read MoreShare Of TV Multitasking Time, October 2014 [CHART]
Some 51% of TV viewers multitask every time or almost every time they watch TV, up from 36% last year.
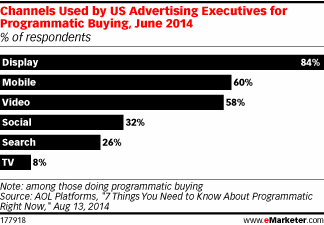
Read MoreTop Reasons Large Advertisers Buy Mobile, October 2014 [CHART]
Customer engagement is one of the key reasons large advertisers buy mobile ads.
Read MoreComparison Of B2C vs. B2B Content Marketing Trends, October 2014 [TABLE]
More B2B (86%) than B2C (77%) marketers are using content marketing this year.
Read MoreChange In Interaction With LGBT Media, June 2014 [TABLE]
LGBT websites and blogs had seen the biggest increase in interaction from gay and bisexual men and lesbian and bisexual women, with 28% and 39%, respectively, saying they had upped their interaction with said media in the past 12 months.
Read MoreGLB Interaction With Ads, June 2014 [TABLE]
88% of US lesbian and bisexual female internet users said they used Facebook for personal communications, and 79% of gay and bisexual males reported the same.
Read MorePrimary Channels In Which Millennials Share Content, June 2014 [TABLE]
25% of US millennial internet users shared digital content via social, with an average four shares per week.
Read MoreConcerns About Using Bitcoin, December 2013 [TABLE]
Consumers are concerned about the unpredictability of Bitcoin pricing, the experimental nature of the virtual currency and the fact transactions cannot be reversed.
Read More