Native Advertising
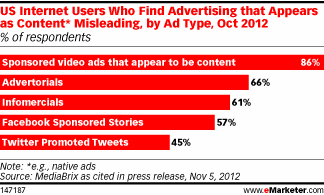
Consumers Who Find Native Advertising Misleading, October 2012 [CHART]
In October 2012, a high percentage of US internet users found ads that appeared as content misleading.
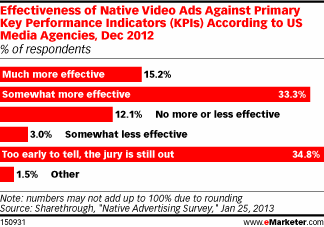
Read MoreEffectiveness Of Native Video Ads, December 2012 [CHART]
A survey of US media agency executives in late 2012 and found that nearly 50% considered native video ads to be more effective than conventional ads at hitting key performance indicators
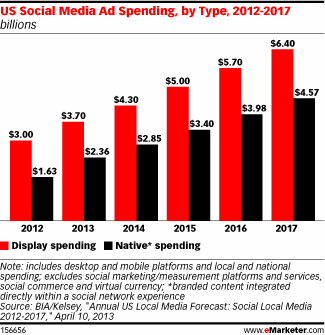
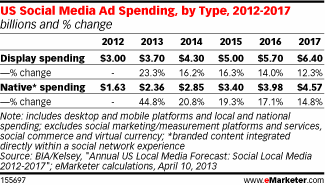
Read MoreUS Social Media Ad Spending By Type, 2012-2017 [CHART]
Social networks, news sites, digital content aggregators and streaming media services are rife with ads that are integrated into the content experience.
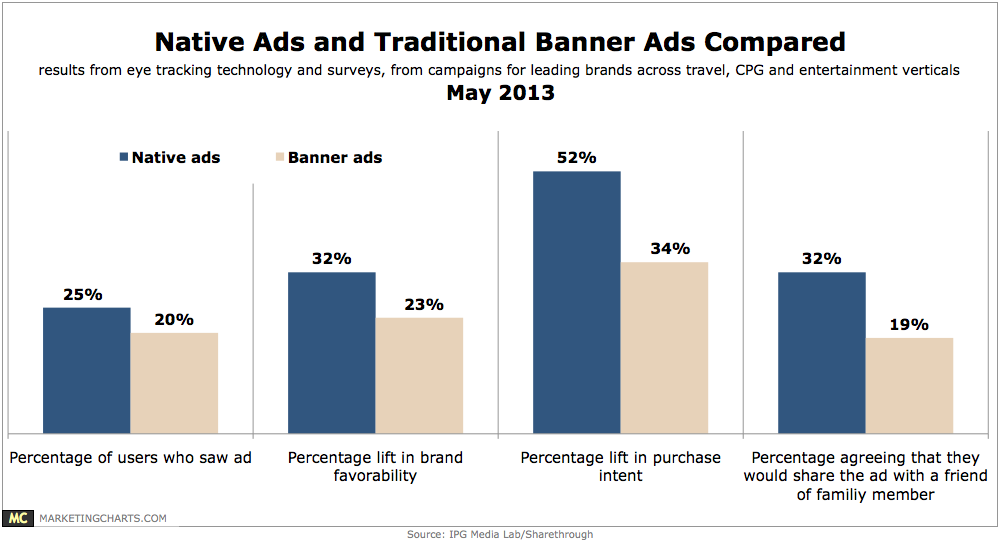
Read MoreNative vs. Banner Ads, May 2013 [CHART]
A study pitting native ads against banner ads has found the former attracting more attention and generating more lift.
Read MoreUS Social Media Ad Spending By Type, 2012-2017 [TABLE]
This year native spending will account for nearly 40% of total social media ad spending.
Read MoreNative Video Ads vs Pre-Roll, March 2013 [CHART]
Native videos drove higher brand lift in each of the 5 campaigns studied compared to pre-roll video ads.
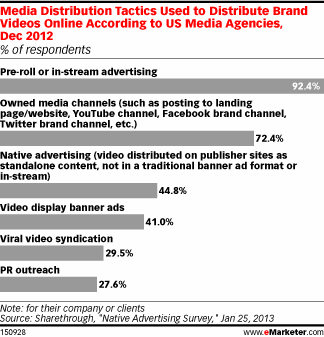
Read MoreBranded Online Video Distribution Tactics, December 2012 [CHART]
Pre-roll or in-stream advertising were the most popular ways to deliver online video to consumers—92.4% of media executives surveyed said they used it.
Read MoreTypes Of Misleading Branded Content, November 2012 [CHART]
A majority of online adults find advertising that appears as content (so-called “native ads”) to be misleading.
Read More