Mobile Search
Daily Mobile Activities, February 2014 [CHART]
Smart phone owners spend a whopping 3.3 hours per day on their phones, while tablet owners are close behind, averaging 3.1 hours a day on their devices.
Read MoreSocial TV & Super Bowl Ads [INFOGRAPHIC]
This infographic from Crowdtap illustrates the social side of Super Bowl ads.
Read MoreEvolution Of The Marketing Department [INFOGRAPHIC]
This infographic by Adecco illustrates the changing nature of the marketing department.
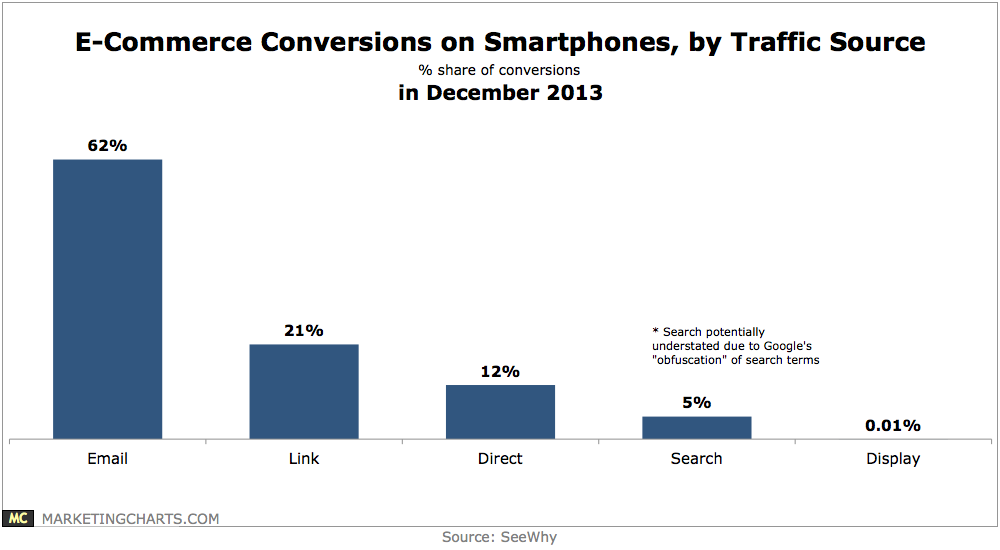
Read MoreSmart Phone eCommerce Conversion By Traffic Source, December 2013 [CHART]
Email may account for upwards of 60% of smartphone conversions.
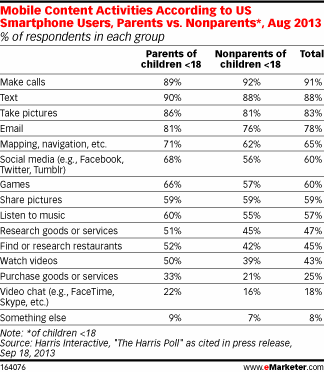
Read MoreMobile Content Activities Of American Parents, August 2013 [TABLE]
Parents of children under 18 were 5 percentage points more likely than nonparents to use email on their smart phone,
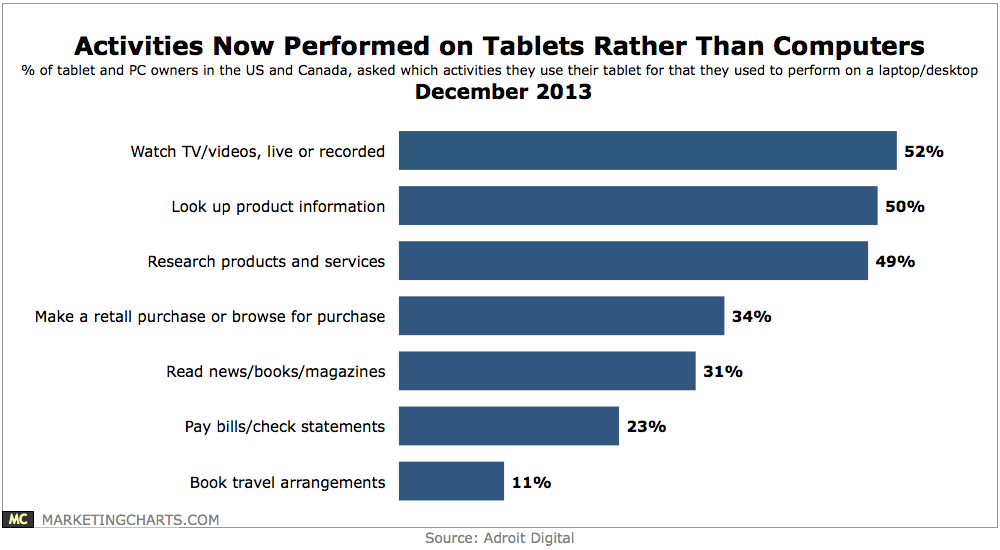
Read MoreComputer Activities Now Performed On Tablets, December 2013 [CHART]
55% of respondents who own both devices would consider purchasing a tablet as a replacement for their personal laptop or desktop.
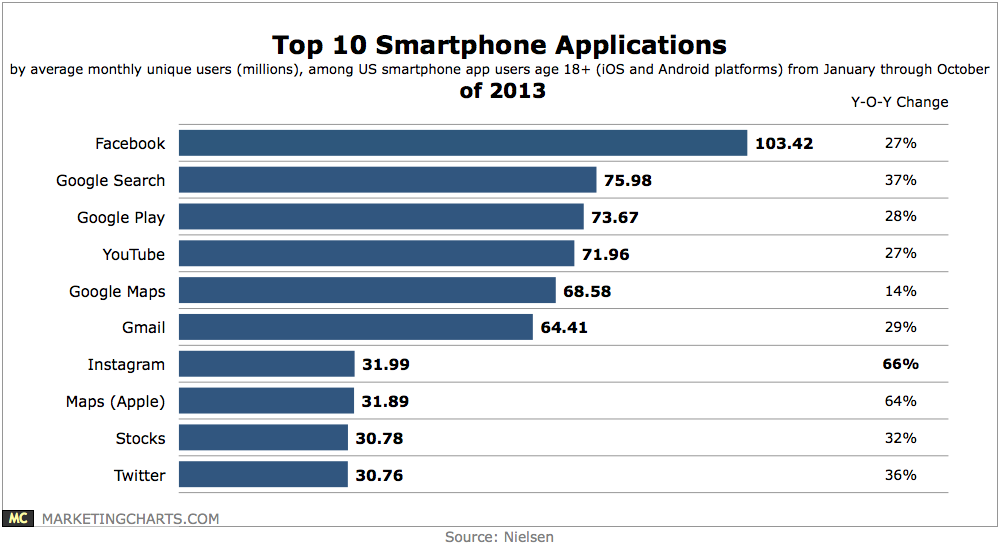
Read MoreTop 10 Smart Phone Apps Of 2013 [CHART]
Facebook and Google are dominant among smart phone apps, accounting for 7 of the top 10.
Read MoreNet US Mobile Ad Revenue Share By Company, 2012-2015 [TABLE]
Google and Facebook grabbed the greatest shares of net US mobile ad revenues, with Facebook jumping from 9.0% to 16.0% between 2012 and 2013.
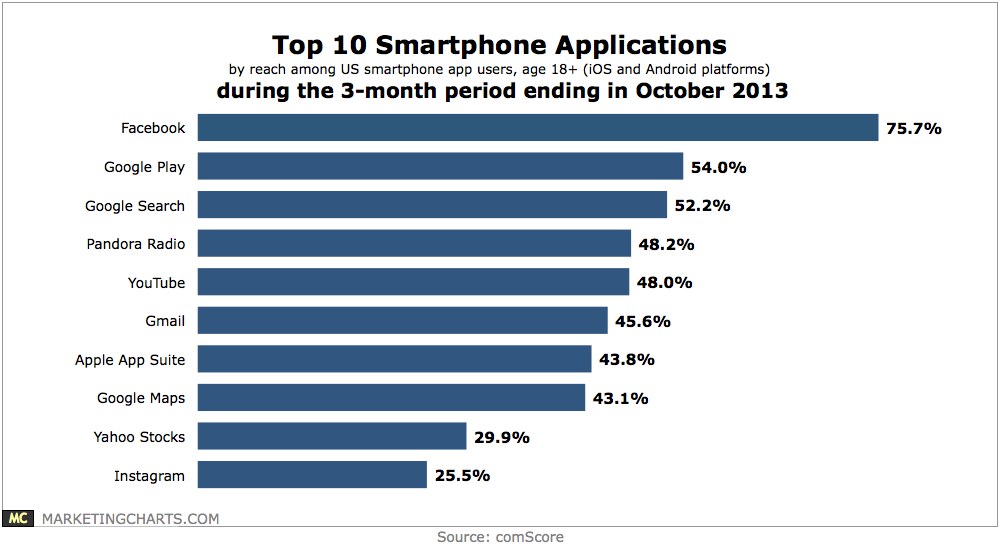
Read MoreTop 10 Smart Phone Apps, October 2013 [CHART]
With 25.5% reach among adult iOS and Android app users, Instagram ranked as the 10th-largest smartphone application during the 3-month period ending in October 2013.
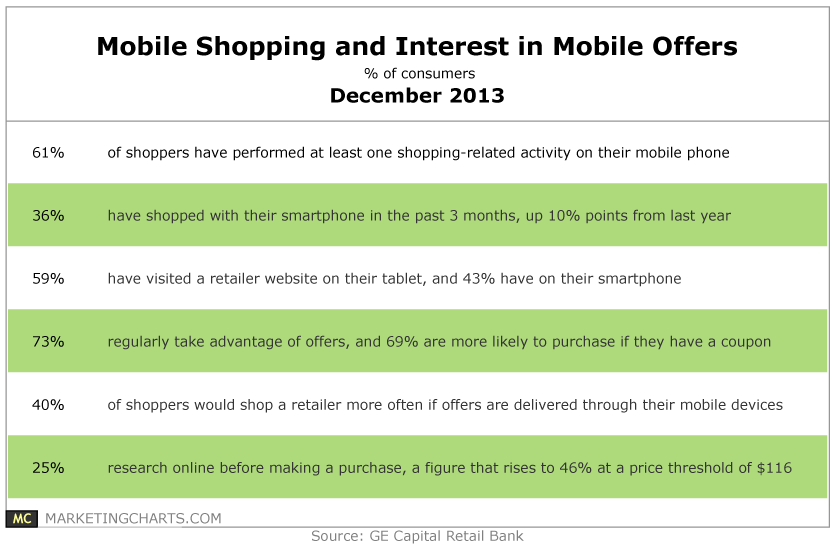
Read MoreMobile Shopping & Mobile Offers, December 2013 [TABLE]
61% of respondents have performed at least a single shopping-related task on their mobile phone, and 36% have shopped on their smartphone at some point during the last 3 months.
Read More

