Mobile Marketing
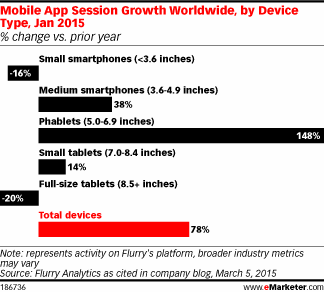
Growth In Mobile App Sessions By Device Type, January 2015 [CHART]
Global mobile app sessions on phablets rose nearly 150% year over year in January.
Read MoreOnline Behavior Of Women [INFOGRAPHIC]
This infographic by Creatage illustrates the online behavior of women.
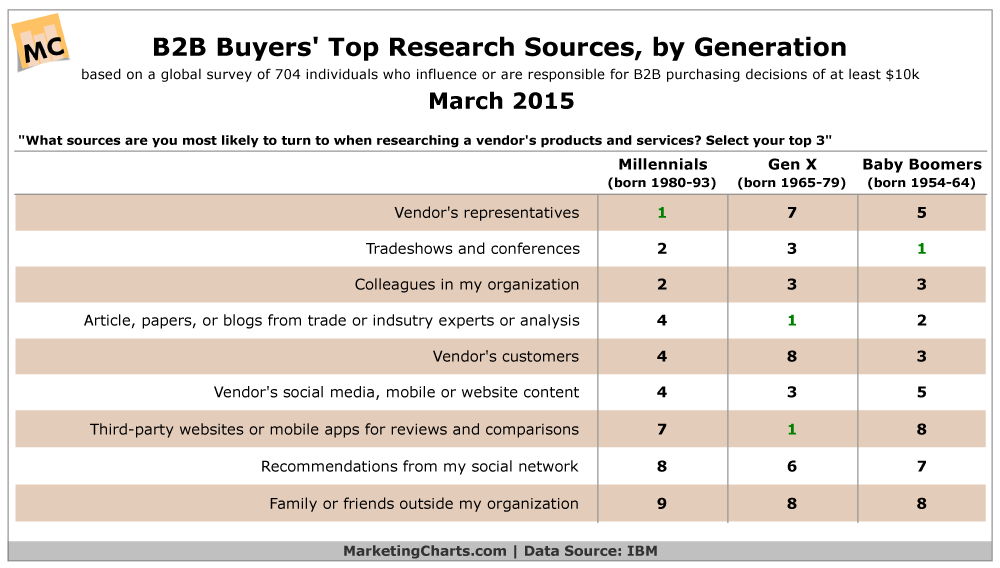
Read MoreB2B Buyers Top Sources For Research By Generation, March 2015 [TABLE]
When it comes to making B2B purchase decisions, Millennials and Gen Xers are more likely than Baby Boomers to believe in the importance of consulting their colleagues and earning team consensus.
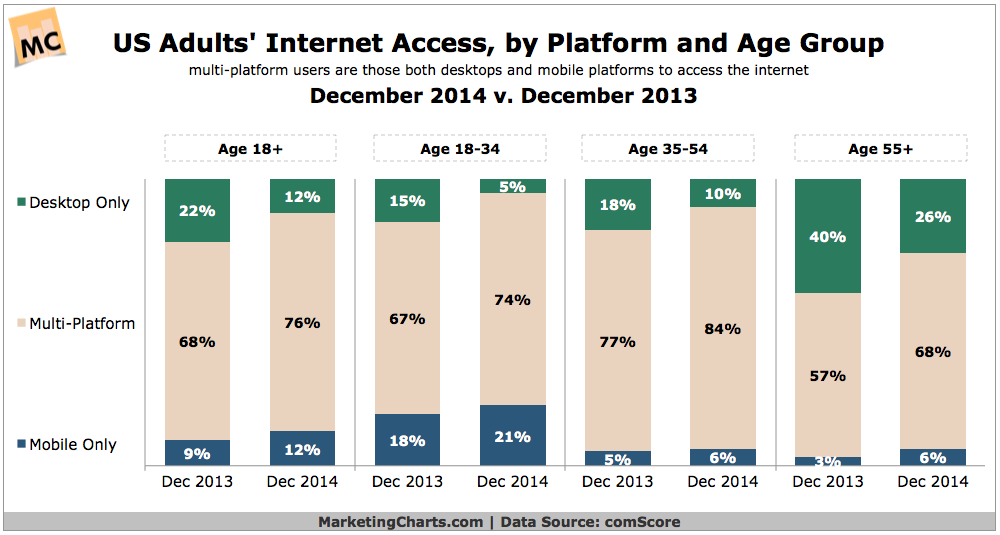
Read MoreMulti-Device Internet Access By Age Group, 2014 vs 2013 [CHART]
Some 21% of online US adults aged 18-34 accessed the internet using only mobile devices in December 2014, up from 18% doing so last year.
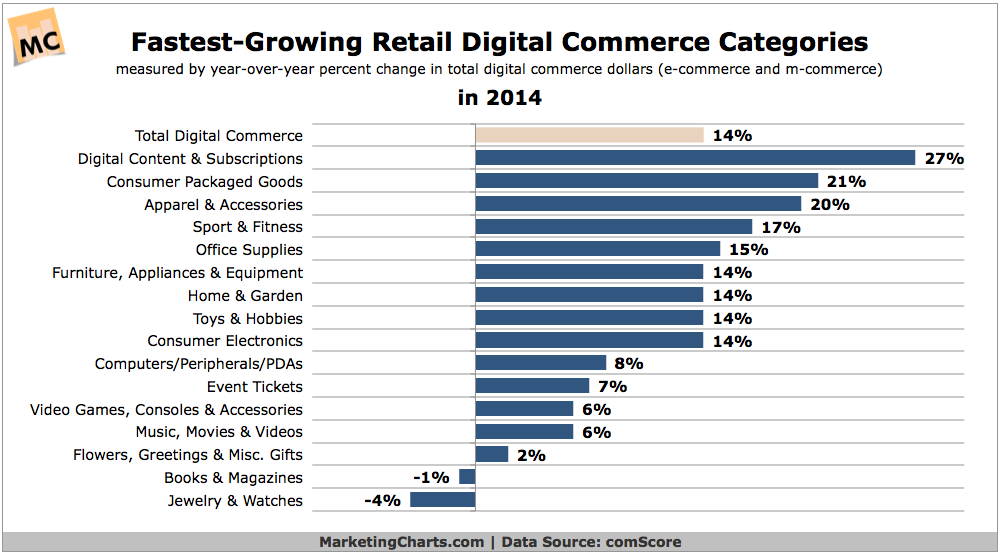
Read MoreFastest-Growing Retail eCommerce Categories, 2014 [CHART]
eCommerce and mobile-commerce spending on digital content and subscriptions increased by 27% year-over-year in 2014, almost doubling the overall retail digital commerce growth rate of 14%.
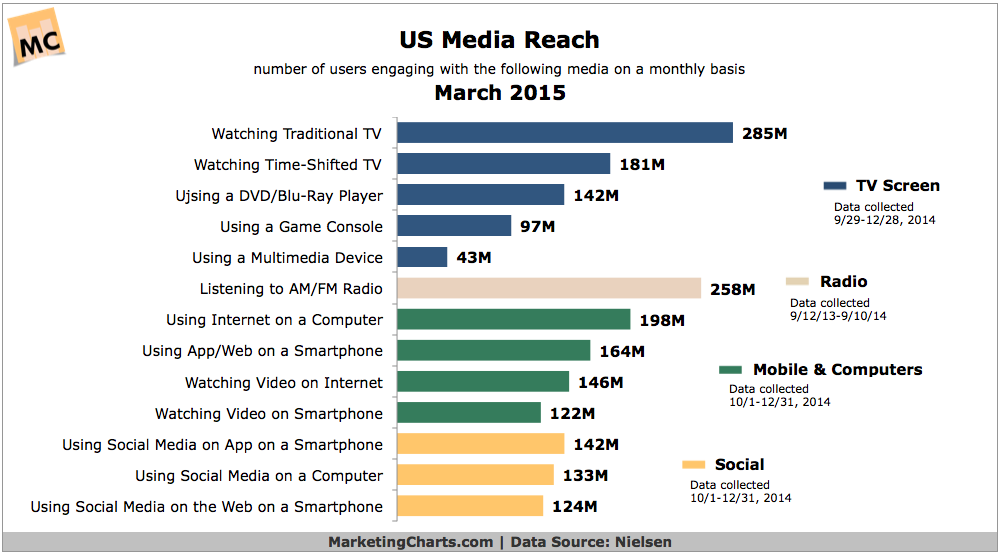
Read MoreUS Media Reach By Channel, March 2015 [CHART]
Some 142M Americans use social media applications on smartphones on a monthly basis, slightly higher than the number using social media on a computer 133 M.
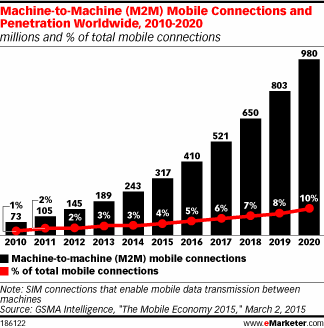
Read MoreMachine-To-Machine Mobile Connections, 2010-2020 [CHART]
GSMA Intelligence estimates forecast that there would be 317 million M2M mobile connections worldwide in 2015—up from 243 million last year.
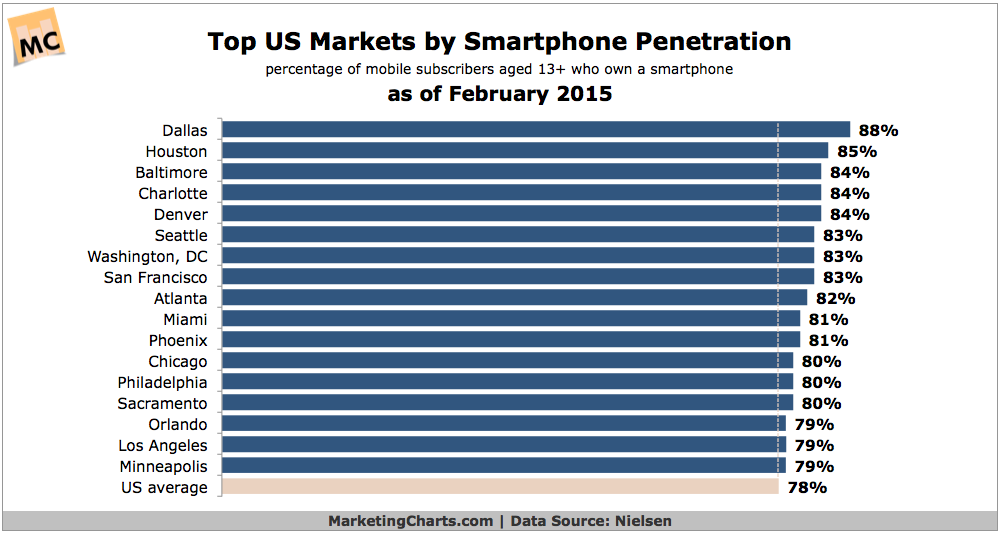
Read MoreTop US Cities By Smart Phone Penetration [CHART]
Smart phone penetration reached 78% of American mobile subscribers aged 13 and older in February.
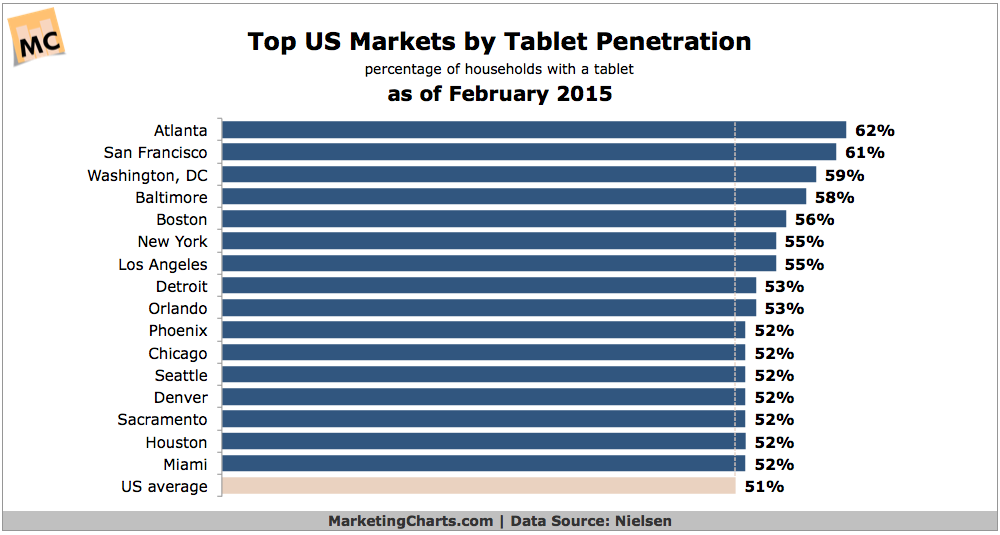
Read MoreTop US Markets By Tablet Penetration [CHART]
Tablet penetration has reached 51% of US households as of February, up 13% points year-over-year.
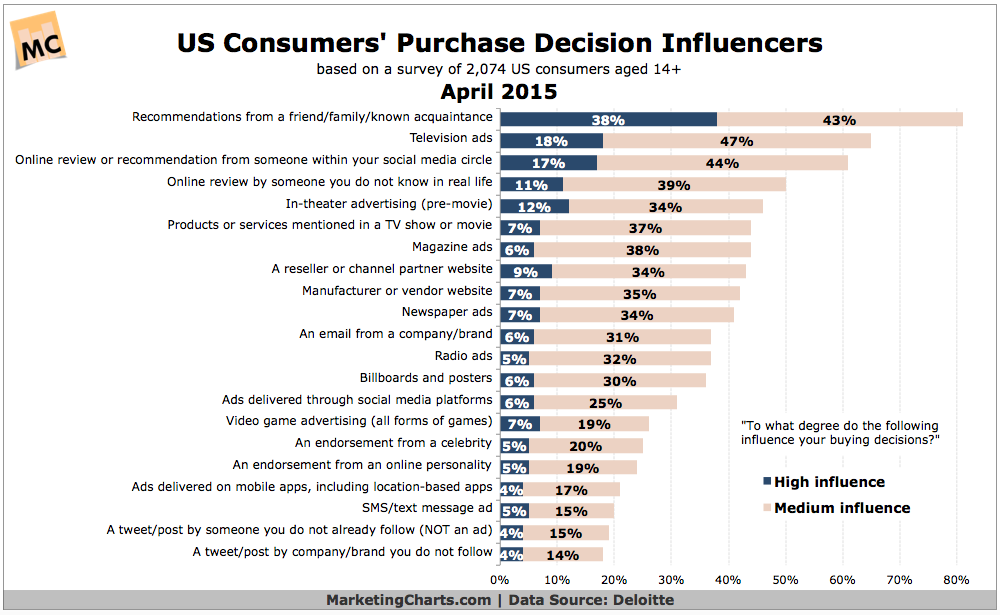
Read MoreTop Influences Over US Consumers' Purchase Decisions, April 2015 [CHART]
When it comes to influencing consumers’ purchases, word-of-mouth continues to outperform all paid media.
Read More