Mobile Marketing
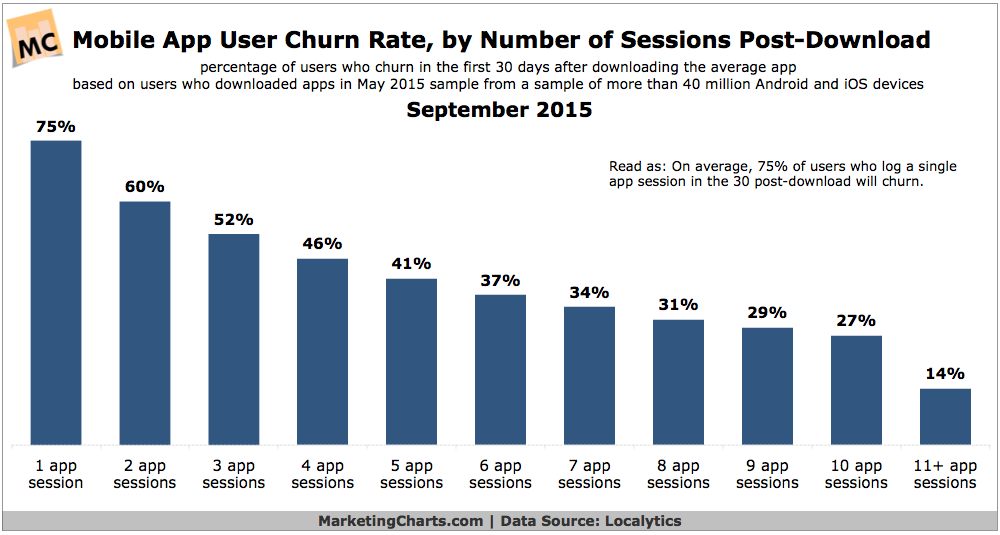
Mobile App User Churn Rate, September 2015 [CHART]
Some 58% of mobile app users will become inactive within the first 30 days after downloading an app, and three-quarters will churn within the first 3 months.
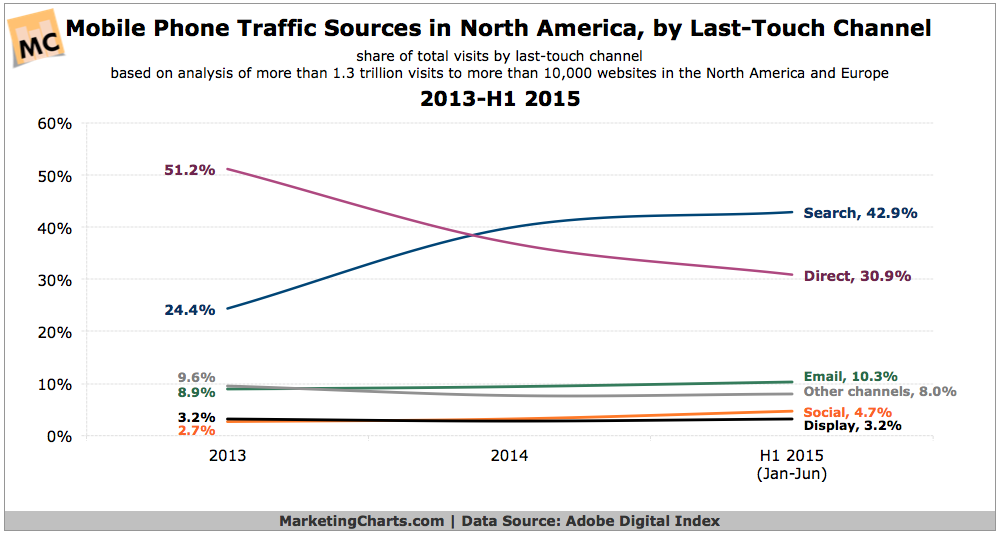
Read MoreTypes Of Mobile Phone Internet Traffic, 2013-2015 [CHART]
Over the past couple of years, search has overtaken direct as the leading referrer of mobile phone traffic in North America.
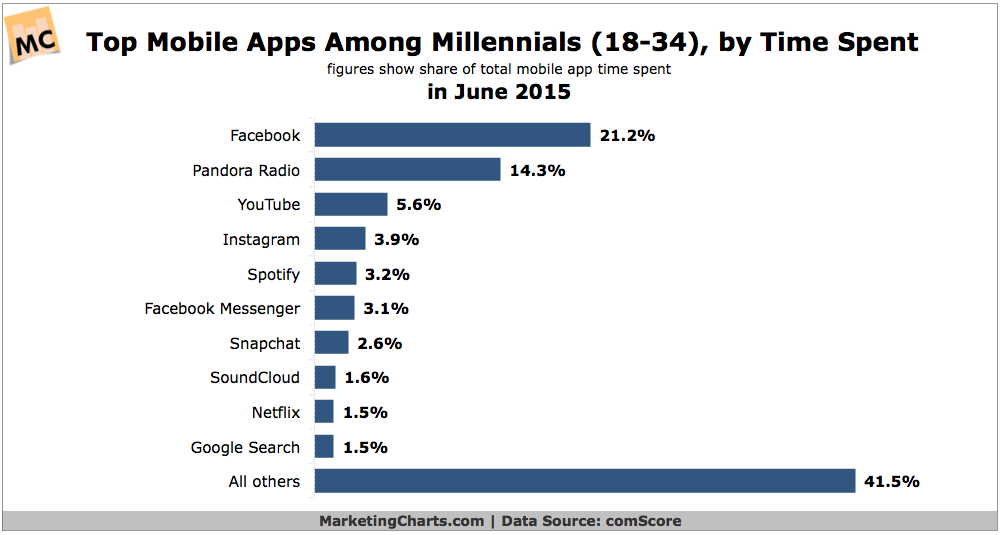
Read MoreMost Popular Mobile Apps Among Millennials, June 2015 [CHART]
Instagram and Snapchat might be rising in popularity with youth, but they don’t hold a candle to Facebook in terms of overall time spent, at least among the 18-34 population.
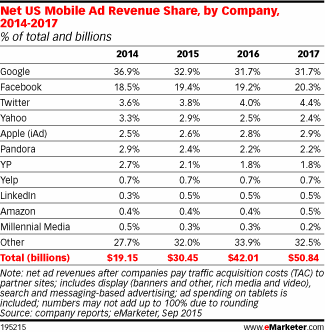
Read MoreUS Mobile Ad Revenue Share By Company, 2014-2017 [TABLE]
Google commands 32.9% of mobile ad revenue in the US, or nearly $10.02 billion.
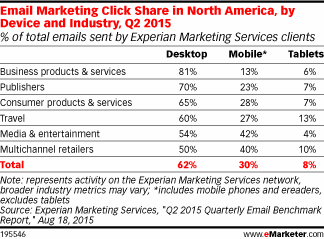
Read MoreMarketing Email Click Share By Industry, Q2 2015 [TABLE]
On average, 62% of clicks happened on the desktop—14 percentage points ahead of the desktop share of opens.
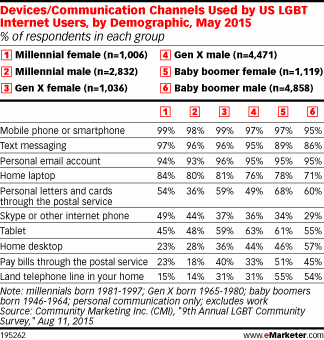
Read MoreCommunication Devices Used By LGBT By Generation, May 2015 [TABLE]
Age has a significant effect on how LGBT internet users behave when it comes to communication channels and devices, both digital and traditional.
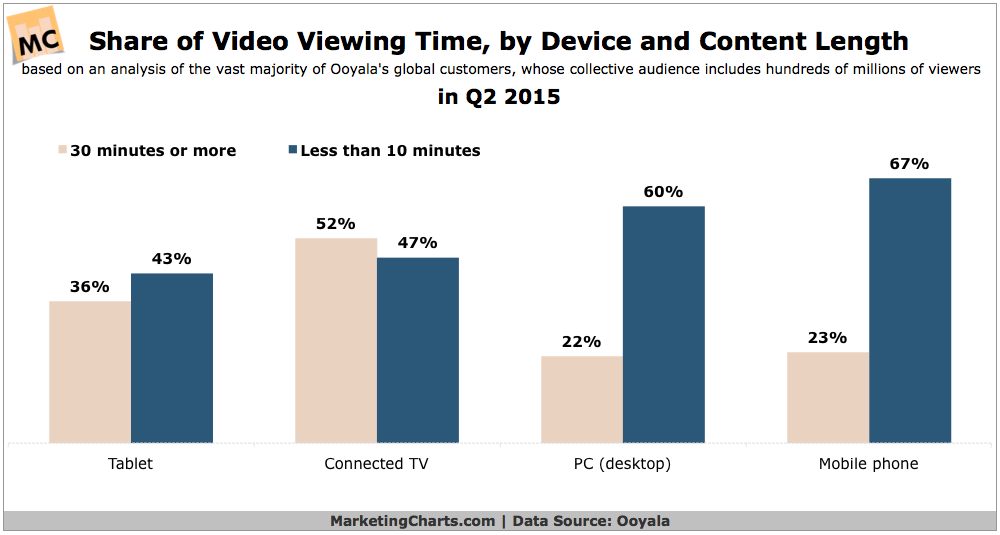
Read MoreShare Of Video Viewing Time By Device & Content Length, Q2 2015 [CHART]
Online video viewers using mobile phones spent two-thirds of their viewing time in Q2 with content less than 10 minutes in length.
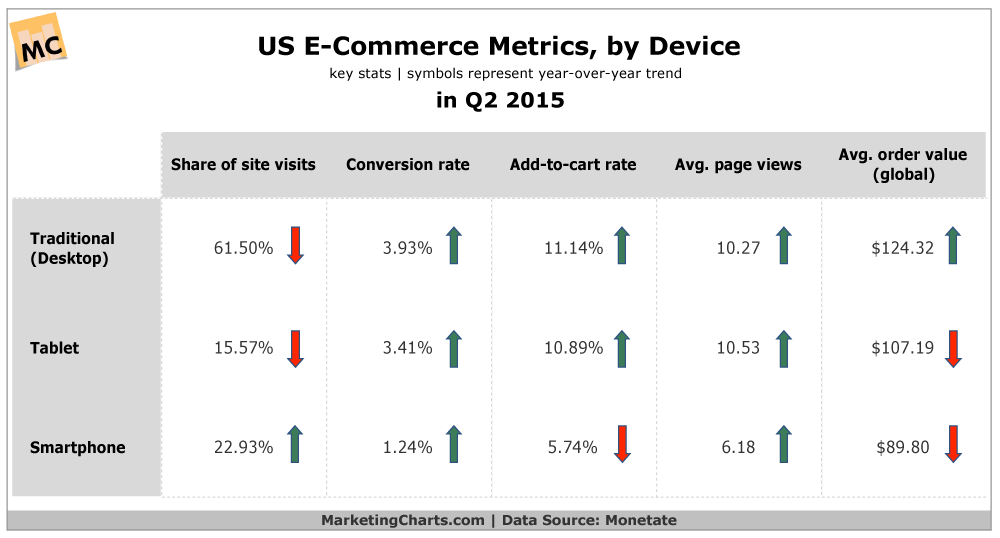
Read MoreUS eCommerce Metrics By Device, Q2 2015 [CHART]
Average order value for visitors referred by social networks grew each quarter during the previous year, but still lagged direct, email and search.
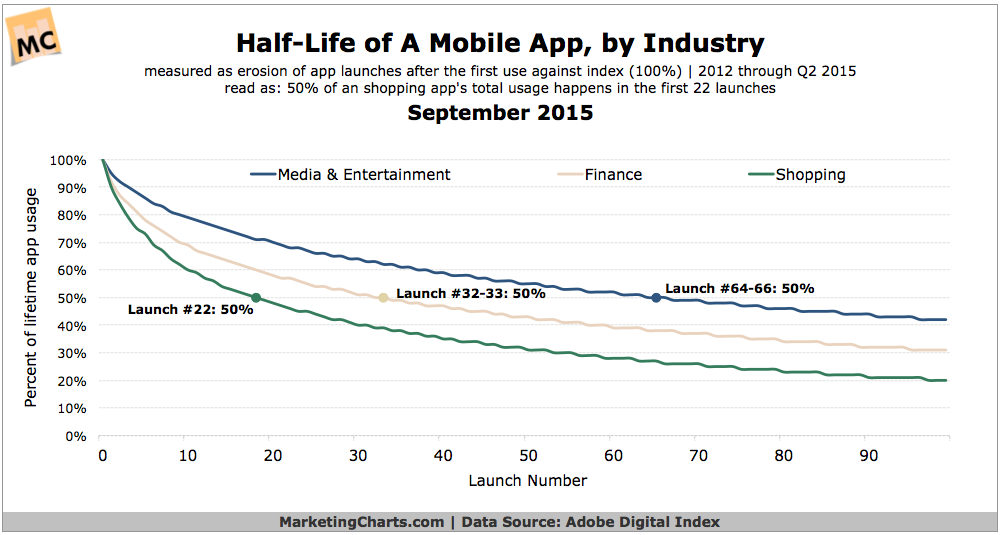
Read MoreHalf-Life Of Media/Entertainment, Finance & Shopping Apps, September 2015 [CHART]
Media and entertainment applications have a slower attrition rate than financial and shopping apps.
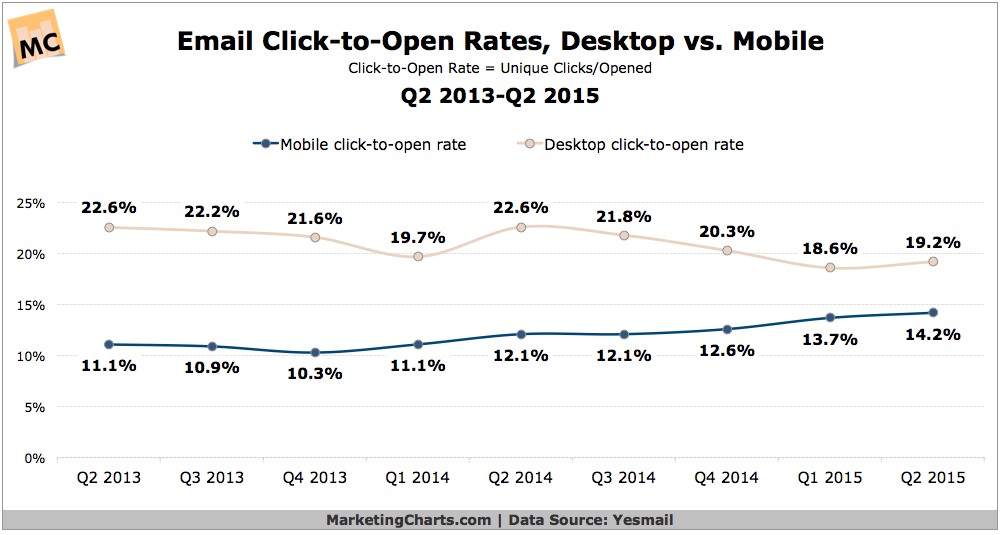
Read MoreEmail Click-To-Open Rates, 2013-2015 [CHART]
Mobile devices have represented the majority of email opens for some time now, but studies have shown that PC users tend to click more than mobile users.
Read More