Mobile Marketing
Snapchat Growth, 2014-2020 [CHART]

In the battle among the social networks to attract new users, 2016 will be a banner year for Snapchat.
Read MoreTop New App Discovery Methods [CHART]
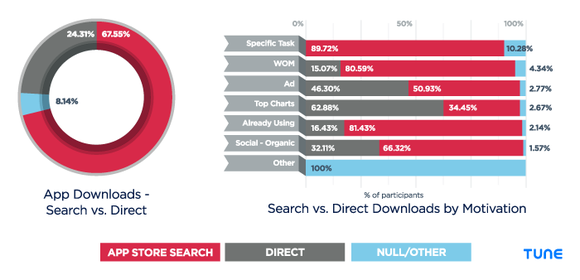
App store search accounts for more than 67% of actual new app discovery.
Read MoreAverage Daily Video Consumption By Device [CHART]
Even in a category as robust as digital video, though, growth has slowed and is expected to slow even more.
Read More5 Most Popular Wearable Devices [CHART]
This year eMarketer estimates wearables usage will grow by roughly 60%, to reach nearly 64 million people.
Read MoreAverage Daily Time Spent With Media, 2012-2018 [TABLE]
Thanks to media multitasking, US adults will squeeze an average of 12 hours, 5 minutes per day of media usage into their waking hours this year—nearly an hour more than the average in 2011.
Read MoreMobile Commerce [INFOGRAPHIC]

This infographic illustrates the mCommerce market, from rising regions, to average order value, to mobile coupon use and payments.
Read MoreSimultaneous Internet & TV Users, 2014-2018 [TABLE]
This year, 182.9 million Americans will use the internet while watching TV at least once a month.
Read MorePolitical Ad Impressions By Device & Campaign Type [CHART]
Desktop video ads have made up the bulk of each campaign’s approach. Local campaigns concentrated on this format the most since the beginning of 2015.
Read MoreUS Coupon Use By Type & Generation [CHART]
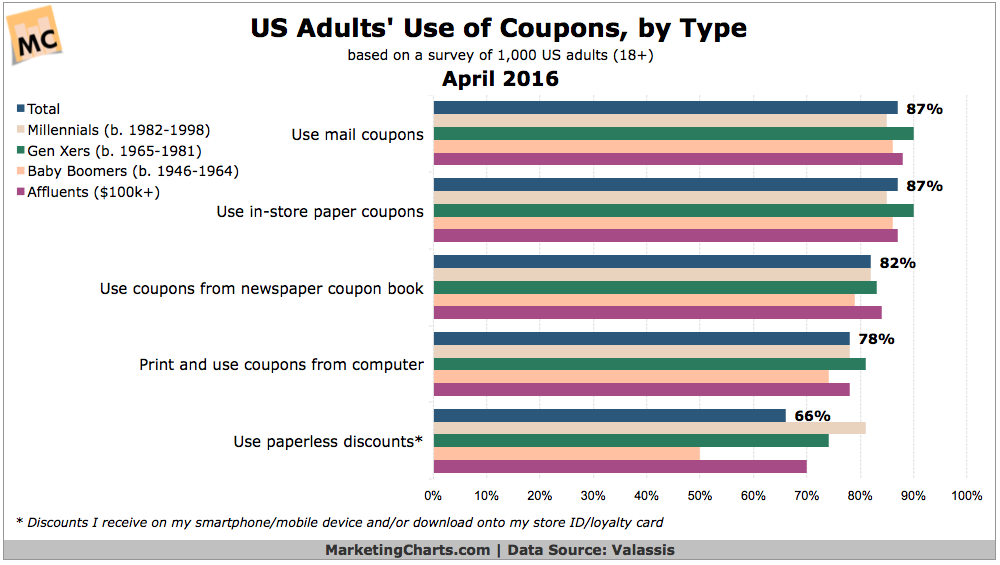
US adults are more likely to use print coupons than paperless discounts, a finding that is true across generations and extends to affluents.
Read MoreMultitainment Behavior By Generation [CHART]
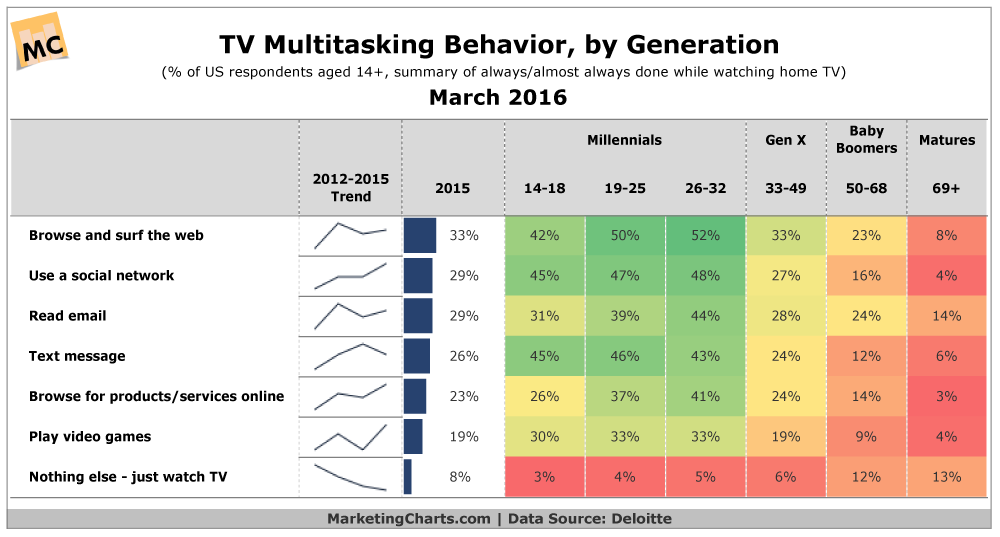
More than 9 in 10 US consumers aged 14 and older say they typically multitask while watching TV, up from about 8 in 10 just 3 years earlier.
Read More