Mobile Marketing
Frequency With Which American Moms Use Online Channels For Health Content, January 2012 [CHART]
In January 2012 that nearly one-third of moms searched the internet for health information once a day or every few days.
Read MoreSmall Businesses & Natural Disasters [INFOGRAPHIC]
74 percent of American small businesses do not have any disaster plan, while 84 percent do not have disaster insurance.
Read MoreMobile Enterprise [INFOGRAPHIC]
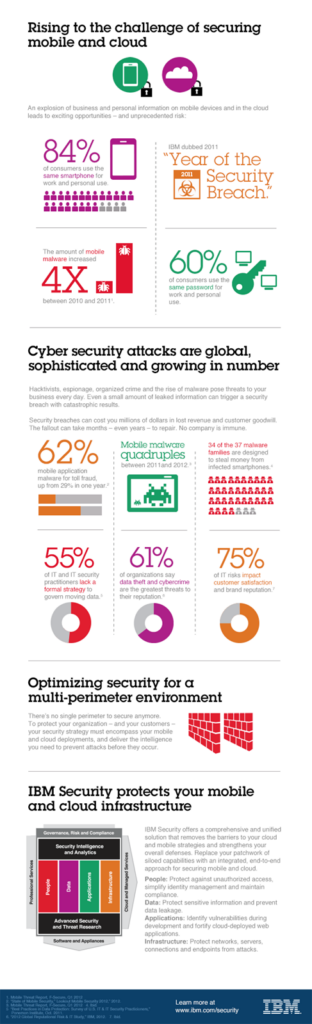
While 84% of consumers now use their personal smart phones for work, mobile malware has increased more than four times since 2010.
Read MoreTop Brand Instagram Adoption [STUDY]
With 90 million monthly active users, 40 million photos per day, and 8,500 likes per second, Instagram has now managed to attract 59% of the world’s top brands.
Read MoreTop Metrics For Evaluating Influencers, December 2012 [CHART]
Facebook friends and Likes and Twitter followers were among the most important metrics used by brands when evaluating these individuals.
Read MoreMost Influential Sites On Purchase Decisions, December 2012 [CHART]
86% of influencers blogged regularly, and more than half operated between two to five blogs.
Read MoreBreakdown Of Top Brands Digital Marketing Budgets, December 2012 [CHART]
65% of top US brands reported participating in influencer marketing.
Read MoreConsumer Attitudes Worldwide Toward Mobile Advertising, February 2013 [CHART]
This chart from Nielsen is a snapshot of consumer attitudes worldwide toward mobile advertising.
Read MoreTime Spent On Mobile vs. PC By Website Type, April 2013 [CHART]
This graphic from comScore illustrates time spent on the Internet using a PC vs. mobile.
Read More