Mobile Marketing
Video Gaming Landscape [INFOGRAPHIC]
This infographic from LUMA Partners illustrates today’s complex video gaming landscape.
Read MorePost-Mobile Search Activity Timing, March 2013 [CHART]
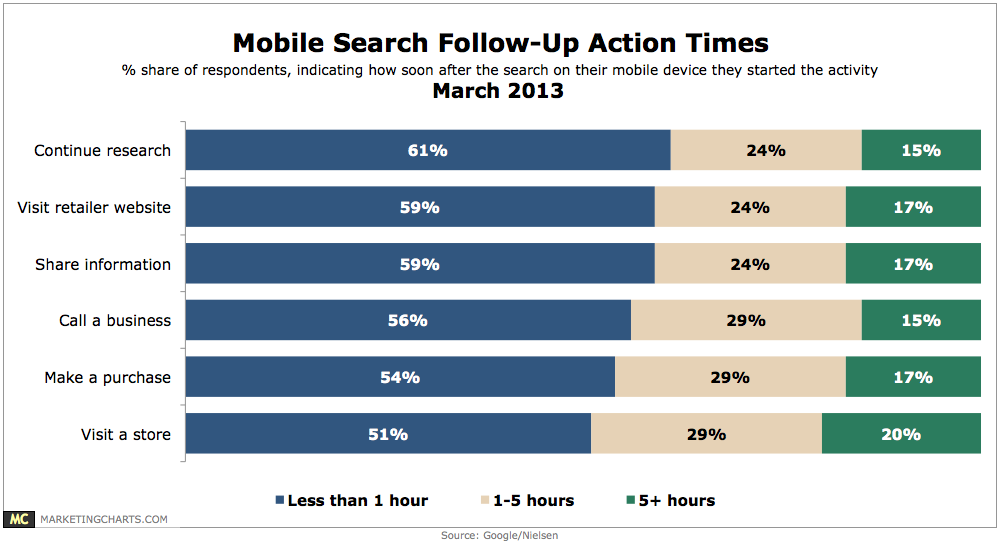
73% of mobile searches trigger additional action and conversions.
Read MoreDigital Marketing Budget Mix In 2012 [CHART]
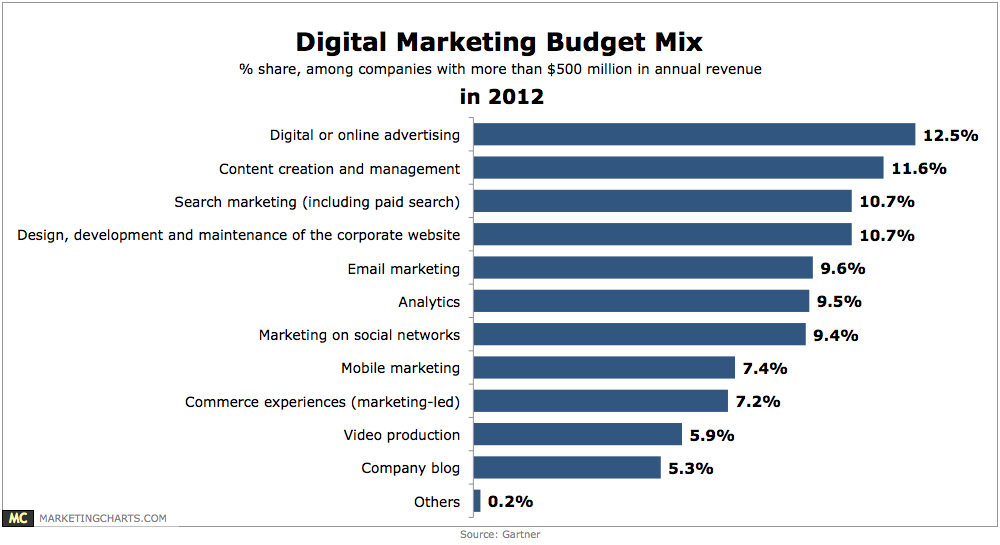
Marketers from companies with more than $500 million in annual revenue are devoting the largest portion of their digital marketing budgets to digital or online advertising (12.5%) and content creation and management (11.6%).
Read MoreeCommerce Landscape [INFOGRAPHIC]
This infographic from LUMA Partners illustrates today’s complex eCommerce landscape.
Read MoreMostly Mobile Online Teens, March 2013 [CHART]
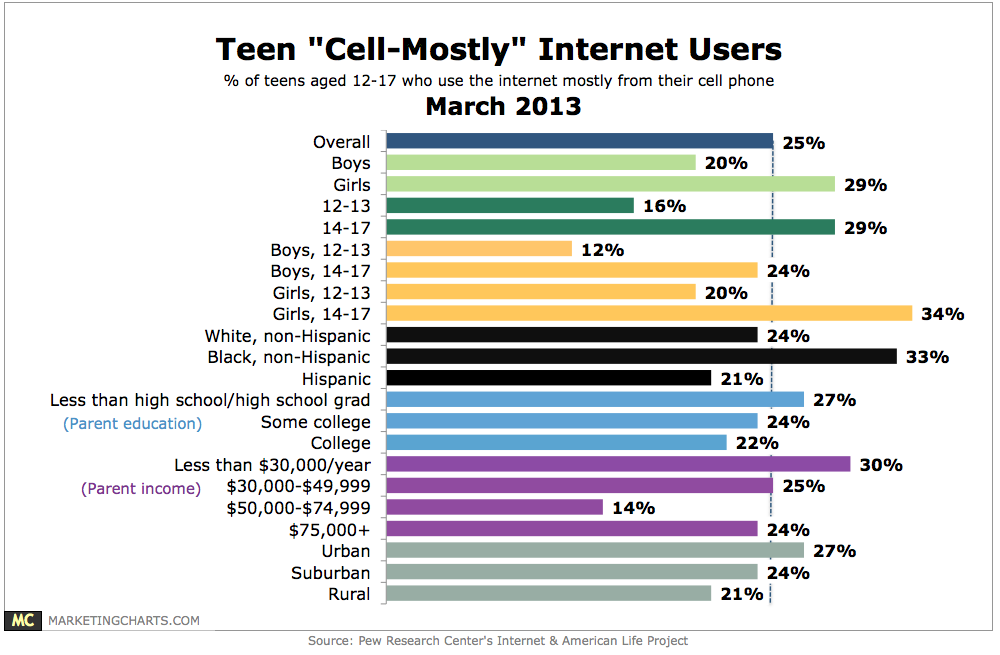
78% of American teens (aged 12-17) now own a cell phone, and 47% of those teens own a smart phone.
Read MoreUS Proximity Mobile Payment Transaction Value, 2011-2016 [CHART]
eMarketer projects that proximity mobile payments in the US are set to explode, growing from $2.12 billion in 2013 to $62.24 billion in 2016.
Read MoreMobile Wallet Services Used For In-Store Purchases, Q1 2012 & Q4 2012 [CHART]
About one-third of mobile Wi-Fi users had used PayPal during the 30 days preceding the poll, compared with 20% for Amazon and 10% for Google.
Read MoreWhy People Use In-Store Wi-Fi By Gender, Q4 2012 [TABLE]
More than nine in 10 American smart phone owners had used their device while at a physical store location.
Read MoreAmerican Mobile, Social & Casual Gamers, 2010-2014 [CHART]
Social games are reaching a level of maturity, and therefore the numbers for monthly unique users are falling.
Read MoreRetailers Benefiting From Showrooming, March 2013 [TABLE]
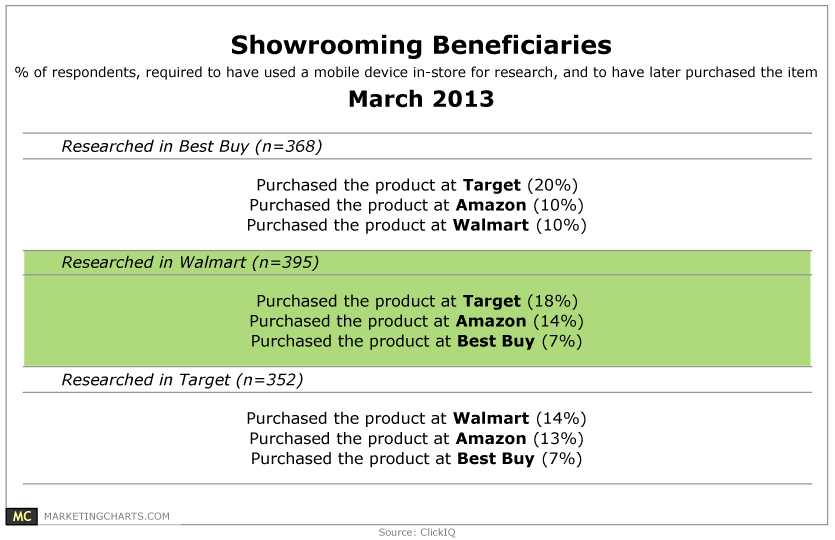
Among those who researched a product while at Best Buy, twice as many ended up purchasing the item at Target (20%) as did at Amazon (10%).
Read More