Mobile Marketing
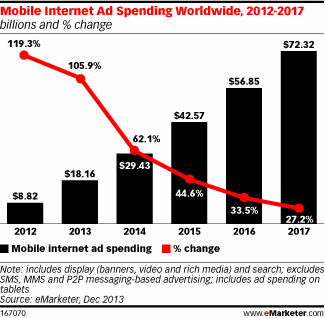
Global Mobile Ad Spending, 2012-2017 [CHART]
The No. 1 goal of mobile ad campaigns worldwide in Q3 was to increase mobile traffic to a site, chosen by 34% of respondents.
Read MoreGlobal Mobile Ad Spending Growth By Industry, Q3 2013 [CHART]
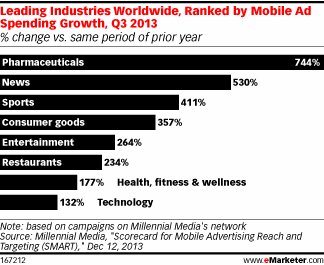
The pharmaceutical industry has done the most to increase mobile ad spending as of Q3 2013.
Read MoreSmart Phone Users Who Have Never Downloaded An App…I Know, Right? [TABLE]
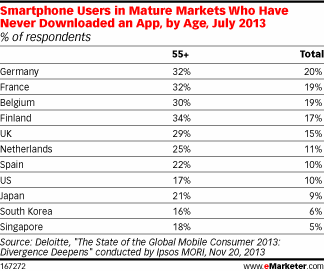
Those ages 55 and up were significantly more likely than average to say they never had downloaded an app on their smart phone.
Read MoreGlobal Mobile Phone Users Who Own A Tablet, July 2013 [TABLE]
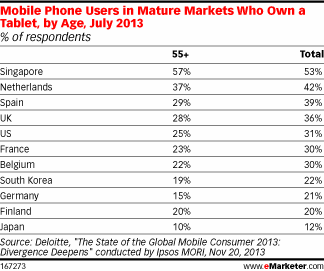
Varying levels of tablet ownership exist among mobile phone users, ranging from just 12% in Japan to 53% in Singapore.
Read More2014 Marketing Budget Plans By Channel [CHART]
9 in 10 business leaders plan to either increase (46%) or maintain (47%) their marketing budgets in 2014.
Read MoreHispanic Parents' Mobile Access By Income, December 2013 [CHART]
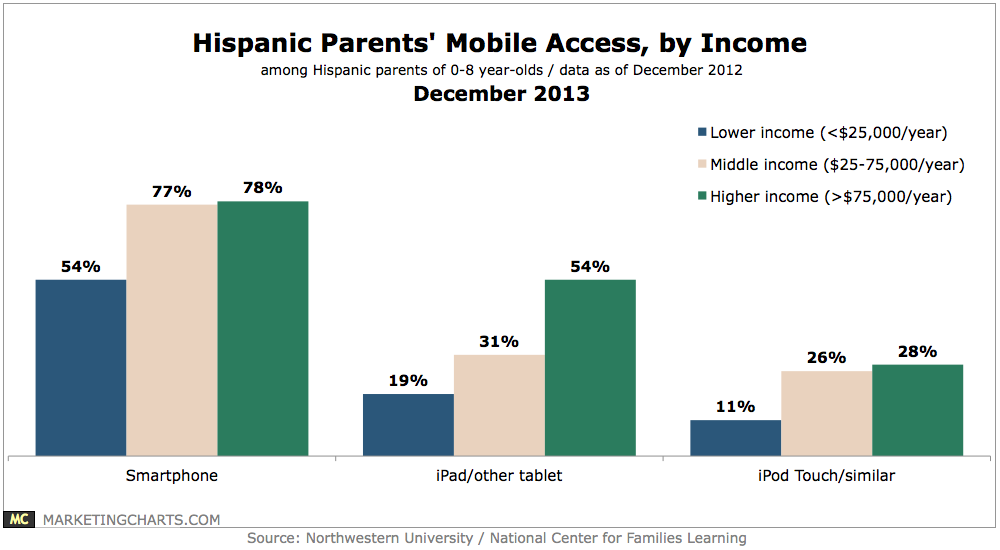
Among Hispanic parents of 0-8-year-olds, 54% of those with incomes of at least $75,000 per year own an iPad or other tablet.
Read MoreUS Gaming Market Size By Screen, December 2013 [CHART]

170 million Americans play videogames, and 60% of those gamers spend money doing so, resulting in an estimated $20.5 billion in spending by the end of this year.
Read MoreTypes Of Video People Watch On Their Smart Phones, Q3 2013 [CHART]
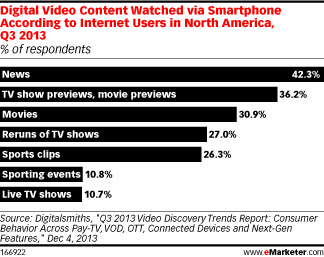
Just over 42% of internet users in North America watched news video content on their smart phones.
Read MoreApple App Store vs Google Play Store Revenues [CHART]
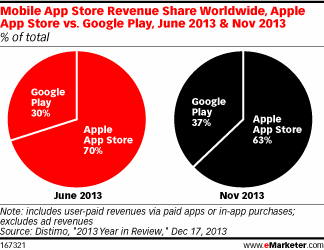
While Apple’s store is still tops around the world in terms of revenues, Google Play did gain share during 2013.
Read MoreMobile App Store Revenue Share By Platform [TABLE]
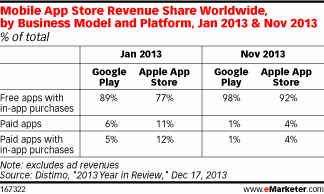
98% of Google Play store revenues and 92% of Apple App Store revenues in November 2013 came from free-to-download apps that offered in-app items for purchase.
Read More