Mobile Marketing
US Health Care & Pharmaceuticals Online Ad Spending By Device, 2014 [CHART]
Health and pharma companies will spend just $373 million, or 26.5% of total digital ad spending.
Read MoreUS Automotive Online Ad Spending By Device, 2014 [CHART]
More than one-third (35%) of US automotive-related digital ad spending will be on mobile this year.
Read MoreUS Retail Online Ad Spending By Device, 2014 [CHART]
Consumers’ widespread use of mobile devices is helping drive retail’s turn to digital media.
Read MoreConsumer Attitudes Toward Mobile Marketing, May 2014 [TABLE]
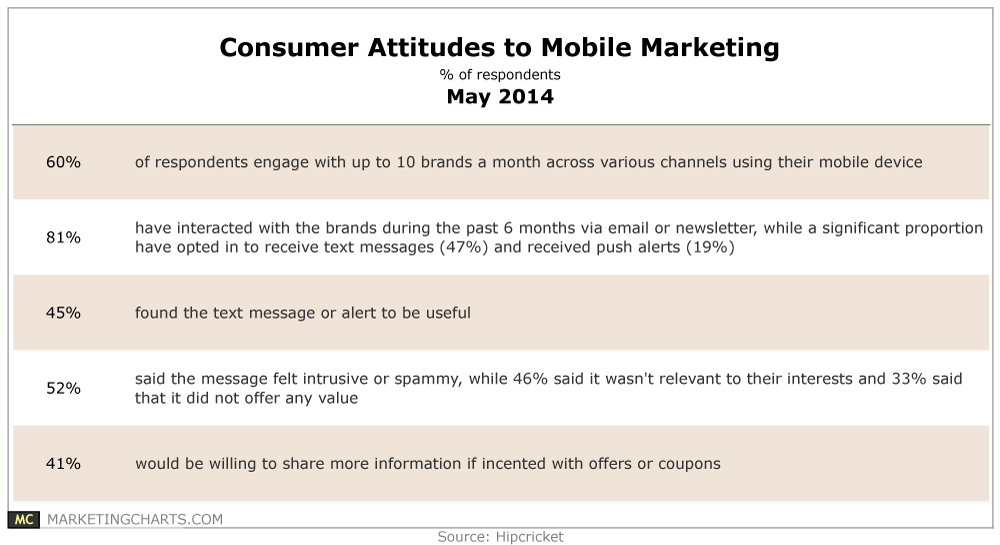
Some 6 in 10 respondents to a Hipcricket survey say they engage with up to 10 brands a month via their mobile devices.
Read MoreDaily Time Spent With Media Among Milllennial & Gen X UK Mothers, April 2014 [TABLE]
86% of UK millennial mother internet users owned a smartphone in 2014, while a further 70% owned a tablet.
Read MoreMillennial Mobile Mothers In Select Countries, 2013 [TABLE]
49.9% of mothers in Great Britain with kids ages 0 to 5 accessed the internet via a mobile device in 2013, vs. just 29.9% of Great Britain’s total population.
Read MoreMarketing Channels With Highest Potential For Revenue Conversion, May 2014 [CHART]
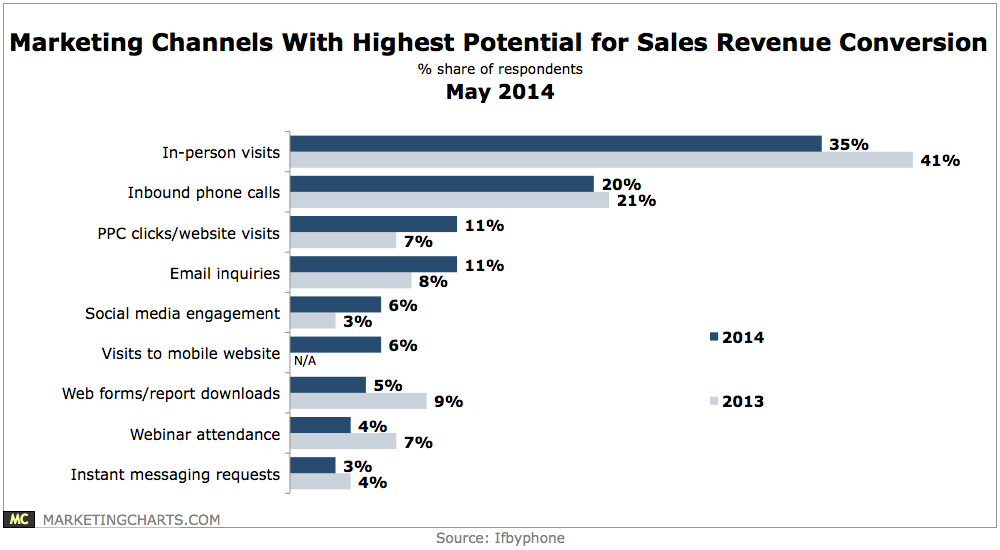
Asked to choose which of 9 channels presents the best bet for sales revenue conversion, a plurality 35% of marketers cited in-person visits, with inbound phone calls (20%) next.
Read MoreMobile Ad Viewability & Engagement Among Executives [CHART]
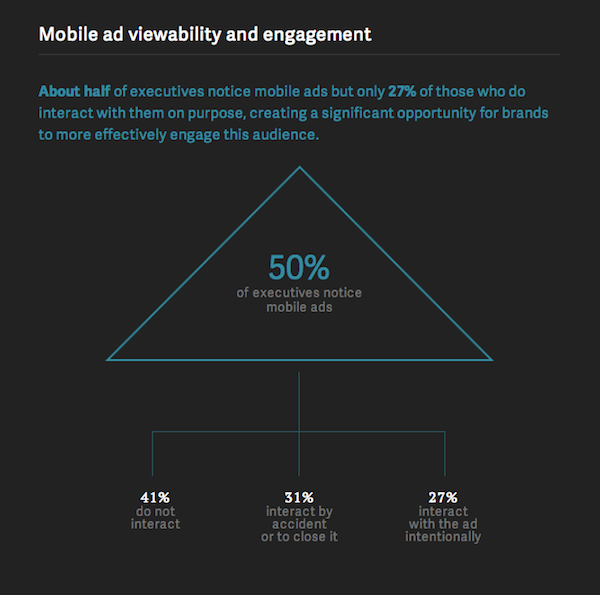
58 percent of executives said desktop ads were more memorable.
Read MoreDevice Executives Most Use To Consumer News [CHART]
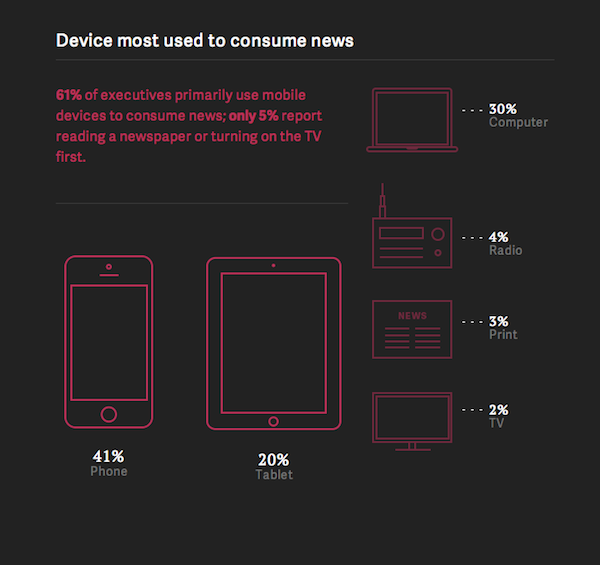
More than 50 percent of the survey responses by executives were completed on a mobile device.
Read MoreUS Travel Industry Online Ad Spending By Channel, 2014 [CHART]

Mobile spending will make up 35.5% of the US travel sector’s $4.15 billion in digital ad investments in 2014 as travel marketers make changes to deal with high mobile device usage.
Read More