Mobile Behavior
B2B Use Of Tablets For Sales Enablement, February 2014 [TABLE]
Some 23% of B2B companies have deployed tablets in sales-related activities.
Read MoreLikelihood Passengers Will Buy Airline Services Via Mobile, May 2013 [CHART]
In 2013, 37% of travelers worldwide said they’d Definitely use their mobile devices to purchase airline tickets & 33% would consider doing so.
Read MoreUS Mobile Travel Bookings, 2012 & 2015 [CHART]
While US mobile travel bookings sat at $6.15 billion in 2012, PhoCusWright forecast this would rise to $39.50 billion by 2015.
Read MoreNorth Americans' Tablet Web Use By Hour, February 2014 [CHART]
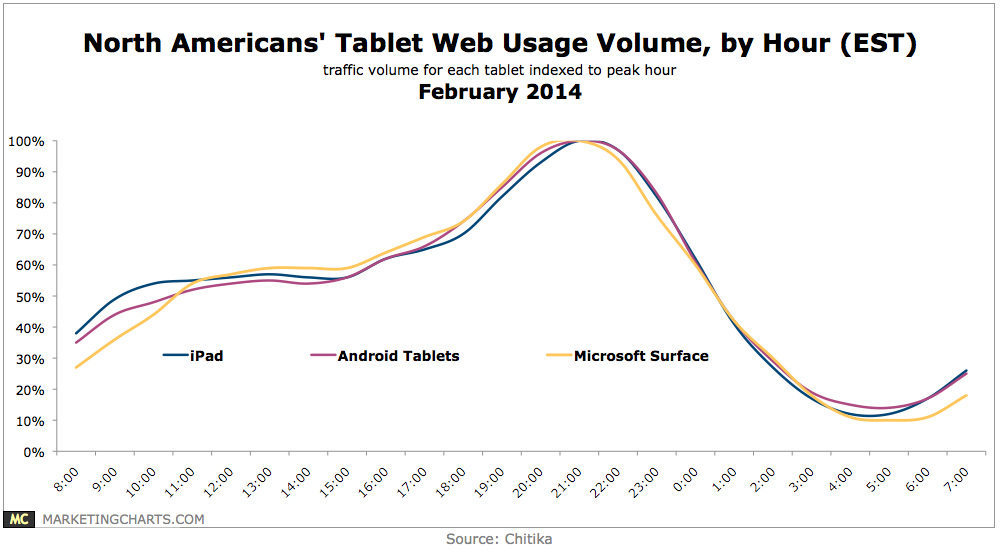
Chitika has taken a look at how tablet usage – in this case web browsing only, not applications – fluctuates during a typical day.
Read MoreHappy eCommerce Customers [INFOGRAPHIC]
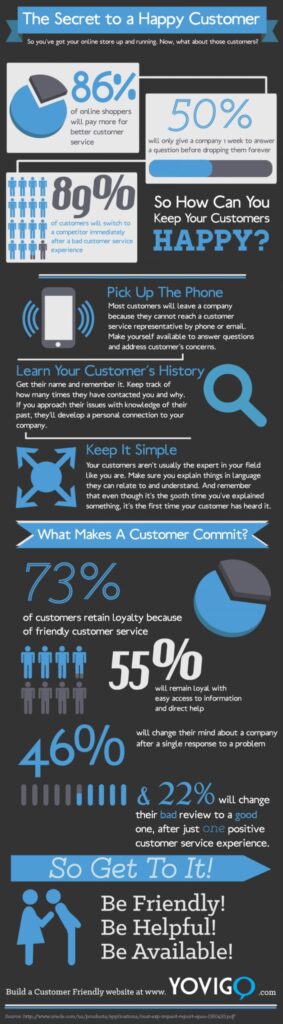
This infographic by Yovigo illustrates what makes eCommerce customers happy.
Read MoreMonthly Time Spent On Social Networks, July 2013 [TABLE]
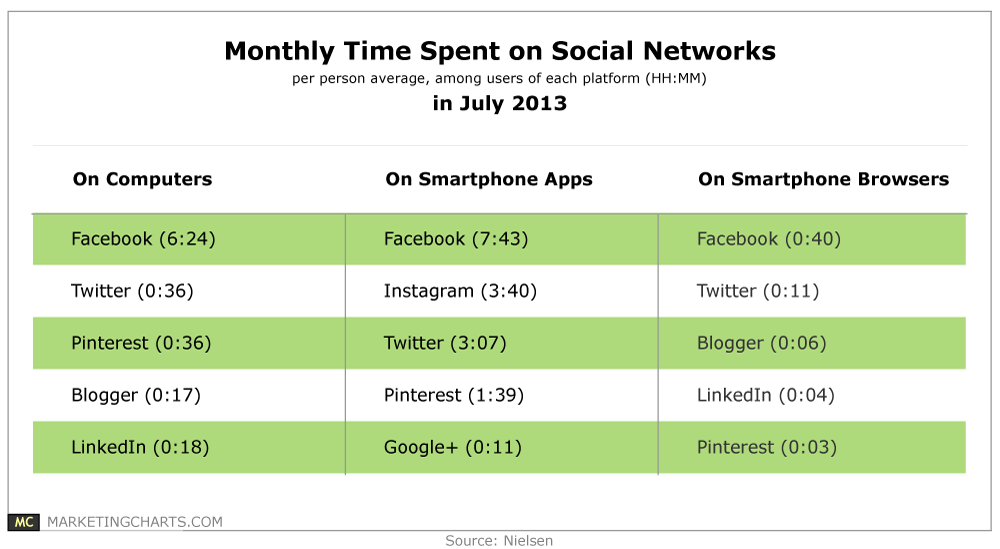
Among smartphone app users in July 2013, Instagram users were spending more time per person per month on the platform (3 hours and 40 minutes) than Twitter users (3 hours and 7 minutes).
Read MoreGlobal Traveler, 2014 [INFOGRAPHIC]
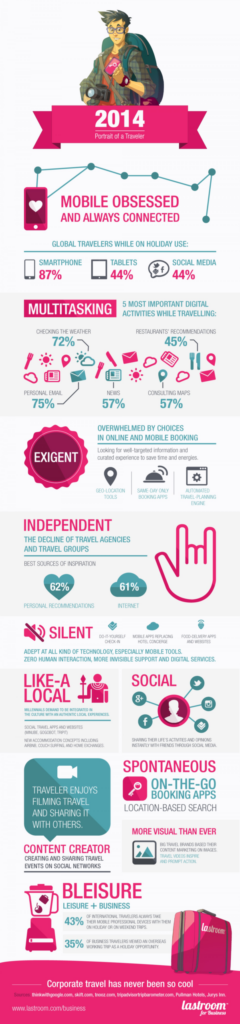
This infographic from LastRoom paints a picture of the behavior of the global traveler of 2014.
Read MoreTop Secondary Actions After Clicking On A Local Mobile Ad, 2013 [TABLE]
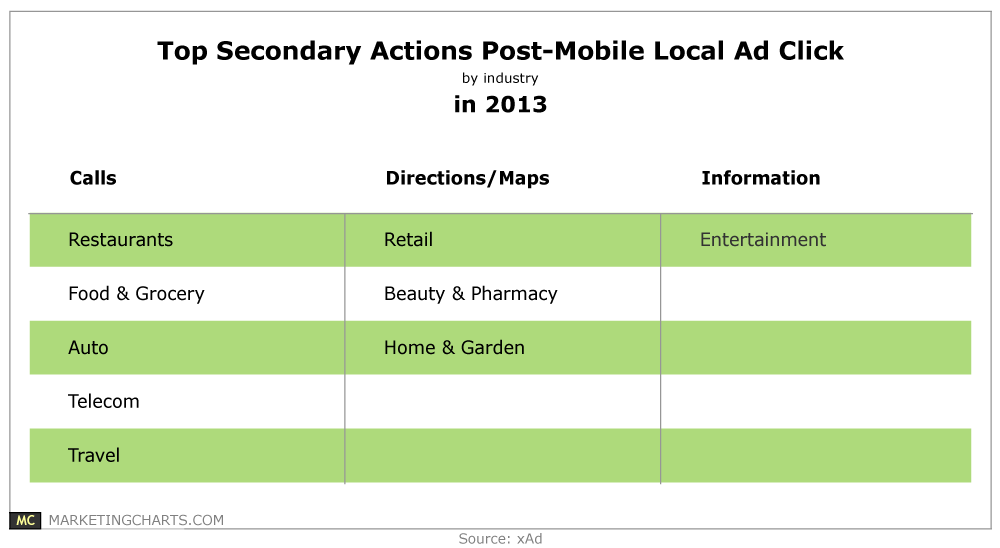
What happens after a mobile users clicks on a locally-targeted ad? Most often, a phone call to the business.
Read MoreMost Important Information On Local Biz Websites, February 2014 [CHART]
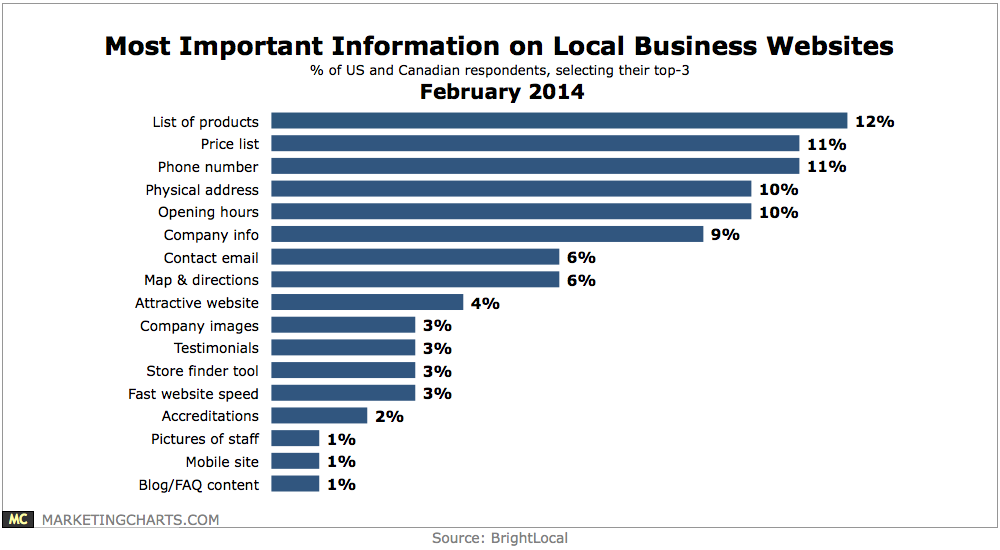
2 in 3 American and Canadian consumers indicate that a local business having a website affects their opinion of the business and whether or not to use it.
Read MoreEmail-Driven Orders By Device, Q4 2013 [CHART]
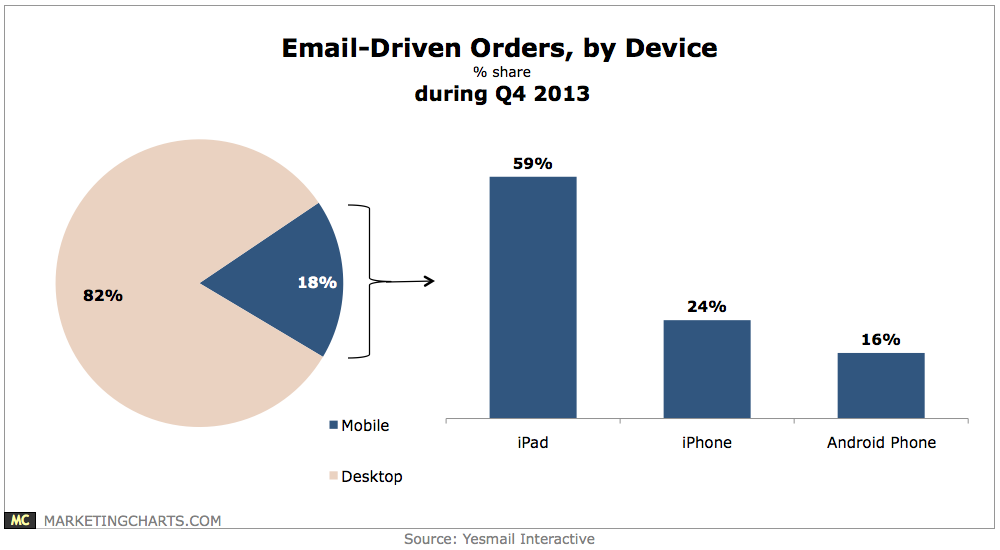
Some 18% of email-driven orders were completed on a mobile device during Q4 2013, up a couple of points from the preceding quarter.
Read More