Mobile Behavior
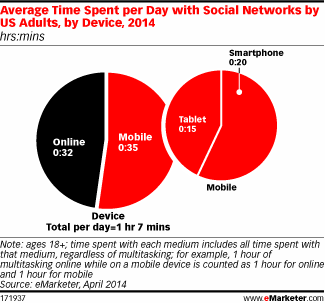
Average Daily Time Spent On Social Networks By Device, 2014 [CHART]
Social network usage among US adults has made the switch to majority-mobile this year.
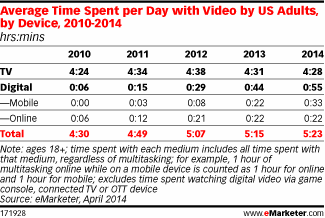
Read MoreAverage Daily Time Spent Watching Video By Device, 2010-2014 [TABLE]
Mobile still accounts for a relatively small share of overall TV/video content viewing time, with an average of 33 minutes per day in 2014 out of a total 5 hours 23 minutes across all devices.
Read MoreShare Of Daily Time Spent With Major Media, 2010-2014 [TABLE]
In 2013, time spent with digital media among US adults surpassed time spent with TV for the first time—with mobile driving the shift.
Read MoreMobile Email Design [INFOGRAPHIC]
This inforgraphic from Litmus warns that 80% of people delete mobile emails that don’t look good and illustrates how to implement responsive email design.
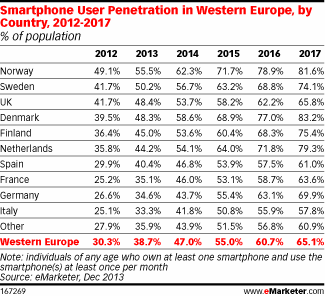
Read MoreSmart Phone User Penetration In Western Europe By Country, 2012-2017 [TABLE]
The number of people in Italy owning at least one smartphone will reach an estimated 25.8 million this year.
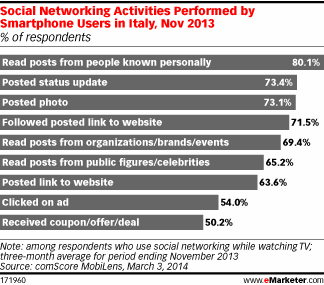
Read MoreItalian Mobile Social Media Activities, November 2013 [CHART]
eMarketer estimates that 41.8% of the Italian population will have a smartphone in 2014—well below the regional average of 47.0%—and a similar gap will persist through 2017.
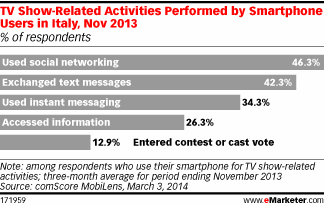
Read MoreItalian Multitainment Activities, November 2013 [CHART]
Almost half (46.3%) of Italian smart phone users who used their phone for any activity related to a TV program said they visited social networks.
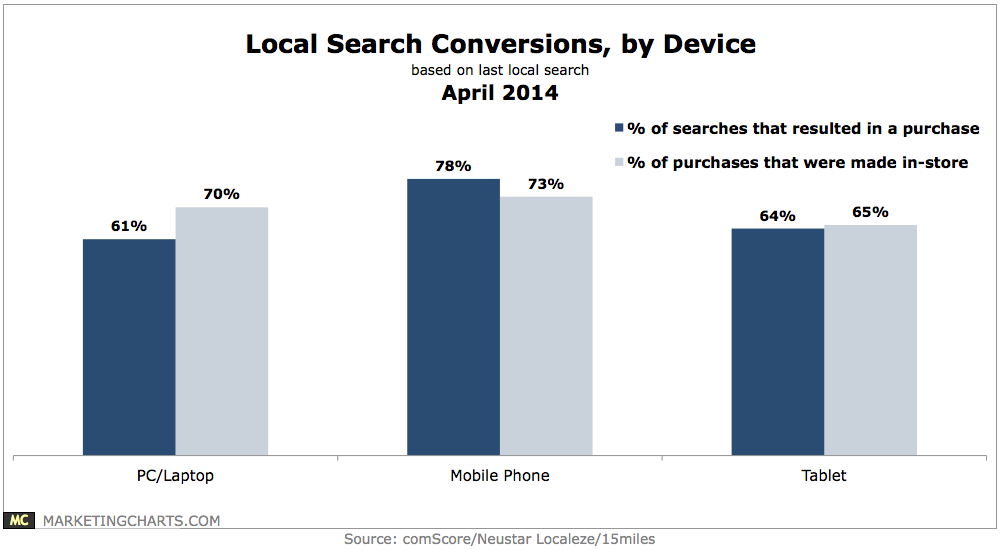
Read MoreLocal Search Conversions By Device, April 2014 [CHART]
Some 78% of local searches conducted on a mobile phone result in a purchase, and 73% of those purchases are made in-store.
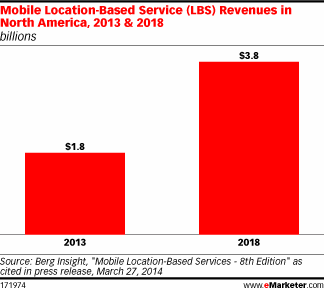
Read MoreNorth American Mobile Location-Based Services Revenues, 2013 & 2018 [CHART]
60% of mobile users now accessing LBS at least monthly.
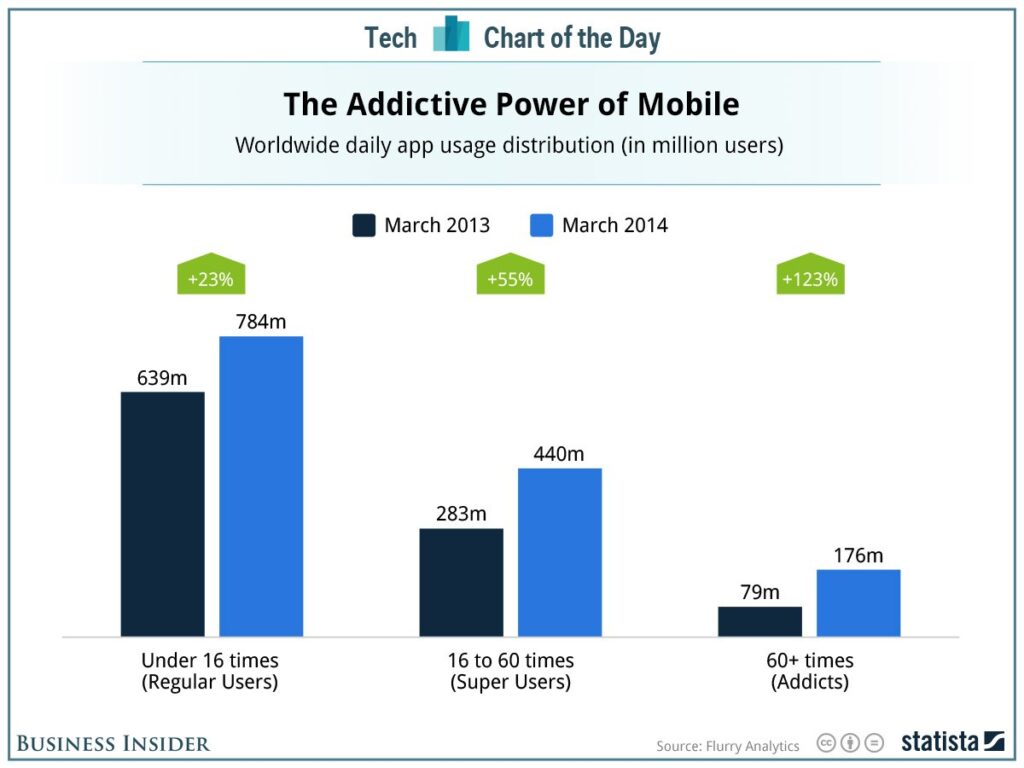
Read MoreGlobal Mobile App Use, March 2013-March 2014 [CHART]
On average, Flurry says a user launches an app 10 times a day.
Read More