Mobile Behavior
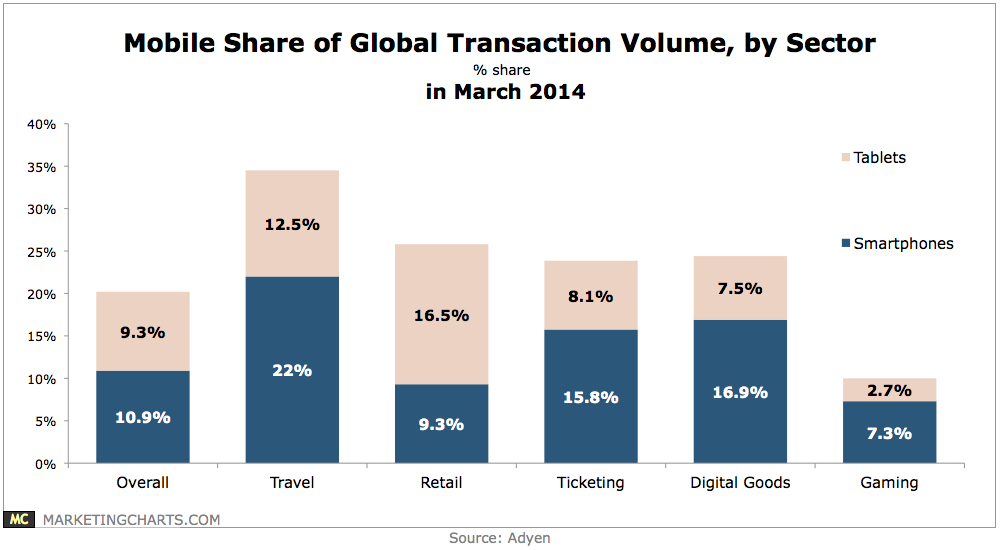
Mobile Share Of Global Transaction Volume By Sector, March 2014 [CHART]
Smart phones (10.9%) and tablets (9.3%) together accounted for more than 1 in 5 payment transactions globally in March.
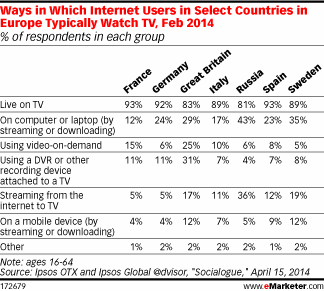
Read MoreHow Select Europeans Watch TV, February 2014 [TABLE]
Just 15% of internet users in France typically watched television via VOD.
Read MoreAmericans Who Abandoned An In-Store Purchase As A Result Of Mobile Use, January 2014 [CHART]
Nearly two-thirds of Gen Xers and Yers said they had decided not to make an in-store purchase based on information they found via smartphone.
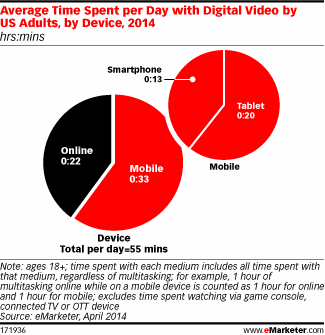
Read MoreAverage Daily Time Spent With Online Video By Device, 2014 [CHART]
In 2014, 113.4 million US tablet users will watch video programming on their devices at least monthly, representing 77.0% of all tablet users.
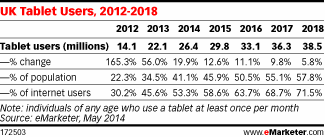
Read MoreUK Tablet Users, 2012-2018 [TABLE]
Driven by the popularity of the iPad, UK tablet usage saw explosive growth over the past few years.
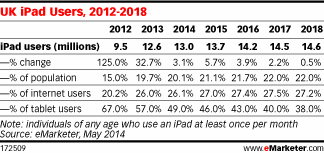
Read MoreUK iPad Users, 2012-2018 [TABLE]
This year, for the first time ever, most people in the UK who use a tablet won’t be using an iPad.
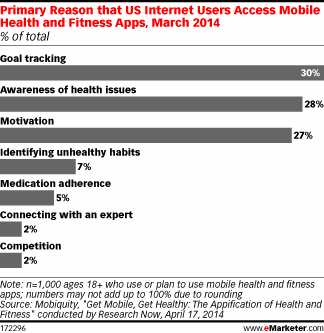
Read MorePrimary Reason People Use Mobile Health & Fitness Apps, March 2014 [CHART]
Goal tracking was the No. 1 reason for accessing mobile health and fitness apps, cited by three in 10 internet users who used or planned to use them.
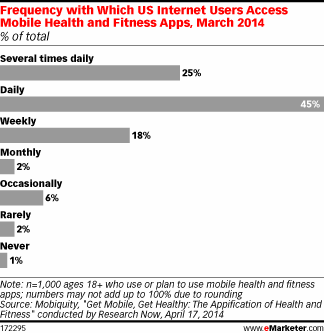
Read MoreFrequency Of Mobile Health & Fitness App Use, March 2014 [CHART]
70% of respondents accessed or planned to access health or fitness apps at least daily.
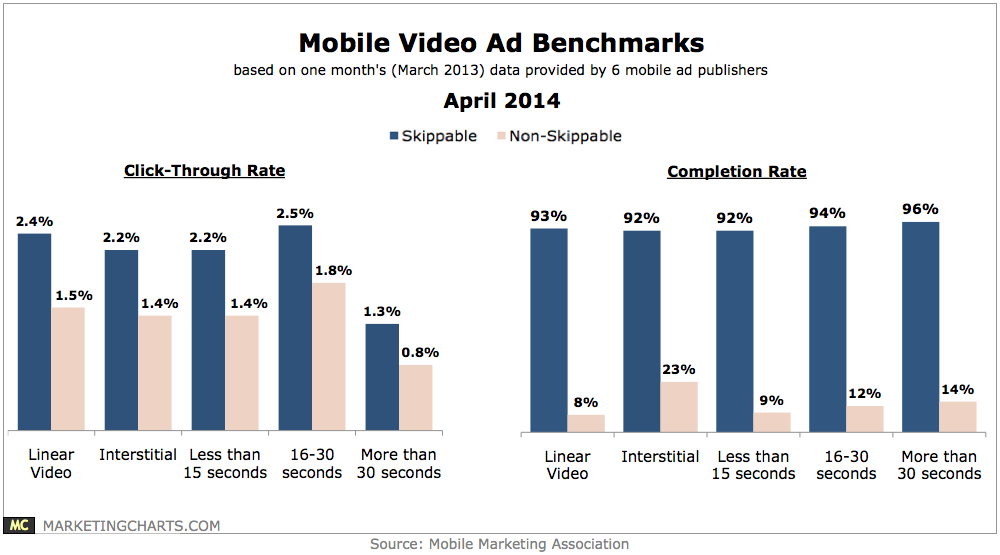
Read MoreMobile Video Ad Benchmarks By Length & Format, April 2014 [CHART]
Completion rates for non-skippable video ads topped 90% for each of the formats measured – linear video (93%); interstitial (92%); and value exchange (97%).
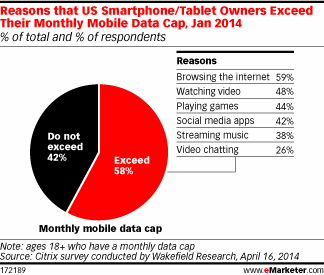
Read MoreWhy Smart Phone & Tablet Owners Exceed Their Data Caps, January 2014 [CHART]
Browsing the internet was the No. 1 reason US smartphone and tablet users had exceeded their data limit.
Read More