Mobile Behavior
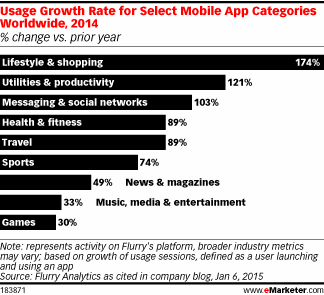
Global Mobile App Use Growth By Select Categories, 2014 [CHART]
Overall app usage—which involves a user launching and actually using an app—grew by 76% year over year in 2014 .
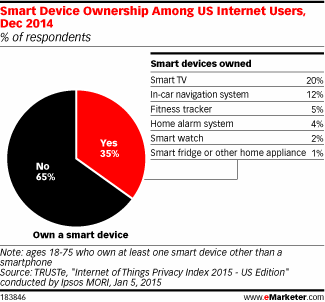
Read MoreSmart Device Ownership In US, December 2014 [CHART]
35% of US internet users own at least one smart device other than a smartphone.
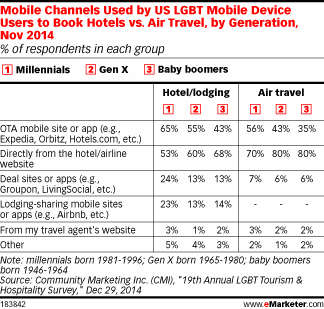
Read MoreMobile Channels LGBT Use To Book Hotels vs Air Travel, November 2014 [TABLE]
Across generations, about 40% of LGBT mobile users reserved hotels through their devices, and more than one-quarter booked flights.
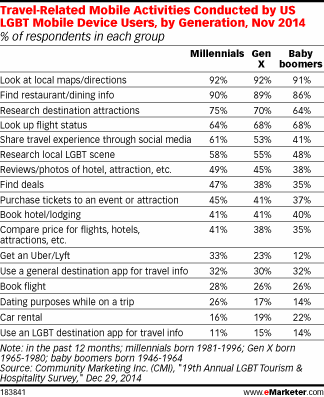
Read MoreLGBTs' Travel-Related Mobile Activities By Generation, November 2014 [TABLE]
Looking at directions and finding restaurant information were the most popular travel-related mobile activities conducted by US LGBT mobile device users.
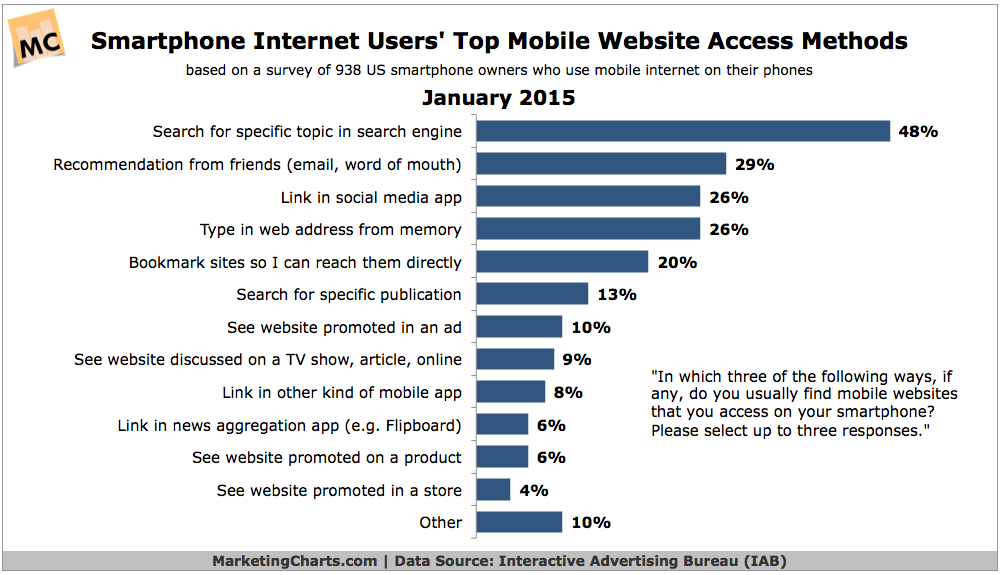
Read MoreTop Mobile Website Access Methods, January 2015 [CHART]
Mobile app consumption relative to the mobile web may be overstated.
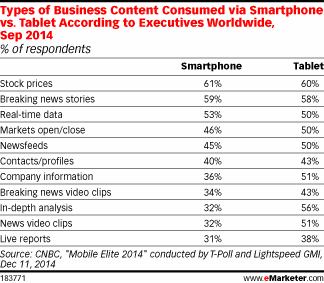
Read MoreBusiness Content Execs Consumed via Smart Phones vs Tablets, September 2014 [TABLE]
Business execs worldwide turned to their devices for a wide variety of information.
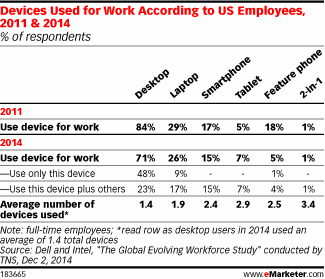
Read MoreDevices Employees Use For Work, 2011 & 2014 [TABLE]
The desktop remained the most-used device for work.
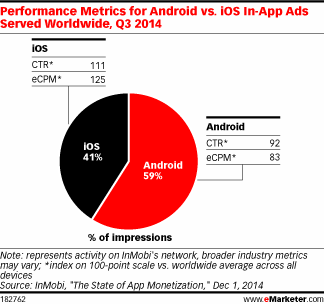
Read MoreAndroid vs iOS In-App Ad Performance, Q3 2014 [CHART]
While the overwhelming majority (85%) of in-app ad impressions took place on smartphones, tablets overindexed for average CTR and eCPM here.
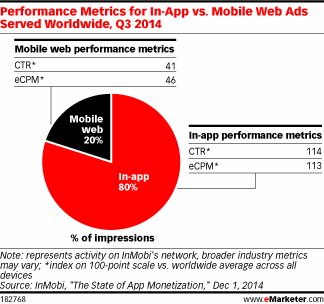
Read MoreMobile Web vs In-App Add Performance Metrics, Q3 2014 [CHART]
Mobile users are far more likely to click on ads served in an app than via mobile browser.
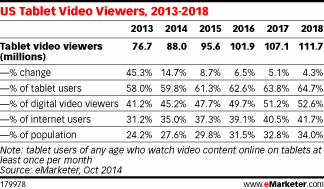
Read MoreUS Tablet Video Viewers, 2013-2018 [TABLE]
The size of the US tablet video-viewing audience is nearly as large as that of the smartphone video-viewing audience.
Read More