Mobile Behavior
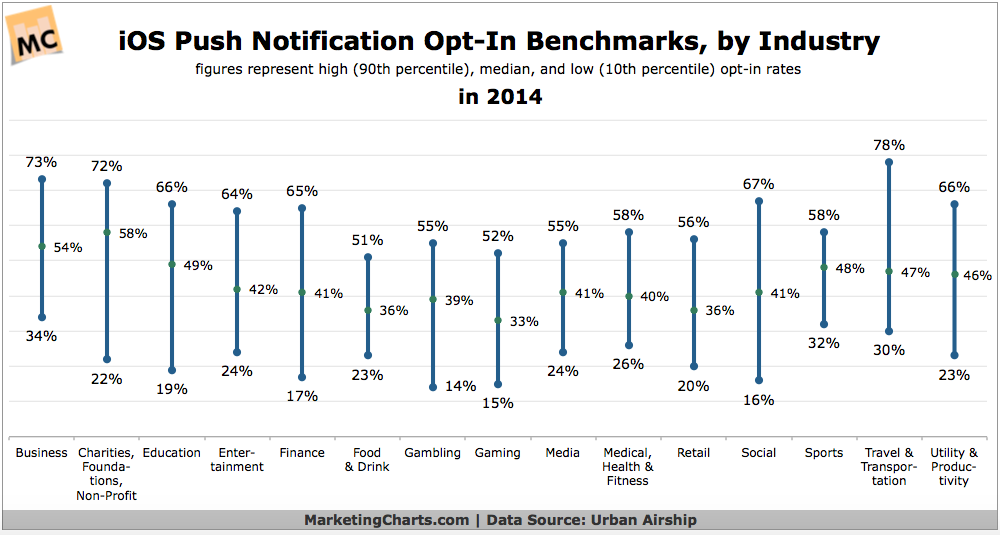
App Notification Opt-in Benchmarks By Industry, 2014 [CHART]
Mobile applications examined by Urban Airship across 15 industries had a median push notification opt-in rate of 42% in 2014.
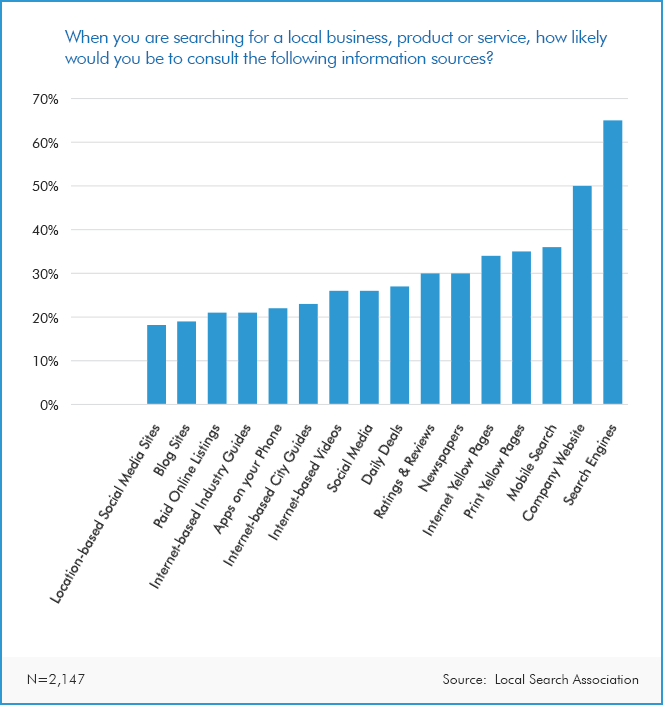
Read MoreSources For Local Business Information [CHART]
While search engines are leaders in the way that consumers look for local businesses and services, other media platforms and competition cannot be ignored.
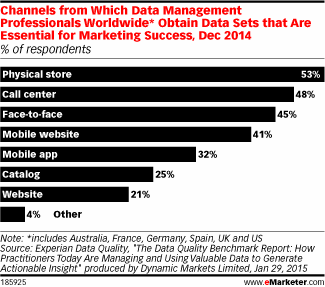
Read MoreEssential Data Sets For Marketing Success, December 2014 [CHART]
Econsultancy found that the most common use of data modeling was for attribution, among both client-side marketers and agency professionals worldwide.
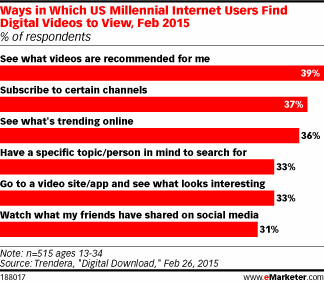
Read MoreHow Millennials Find Online Videos, February 2015 [CHART]
Millennials don’t find videos; videos find them.
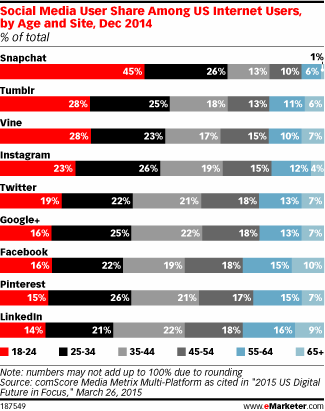
Read MoreSocial Network Usage Share By Site & Age, December 2014 [CHART]
This year, 95.0% of 18-to-24-year-old internet users in the US will log on to a social network via any device at least once per month.
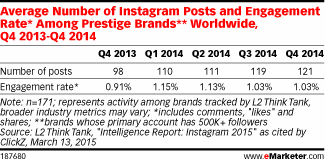
Read MoreFrequency Of Prestige Brand Instagram Posts & Engagement, Q4 2013-Q4 2014 [TABLE]
Instagram presents brands with an audience that’s enthusiastic about engagement.
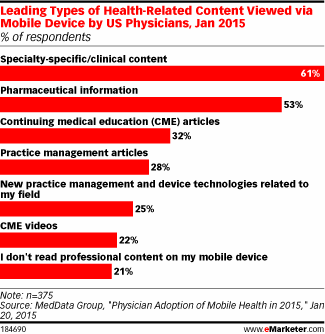
Read MoreTop Mobile Content Consumed By Physicians
Specialty-specific or clinical content was the leading type viewed via mobile by US physicians.
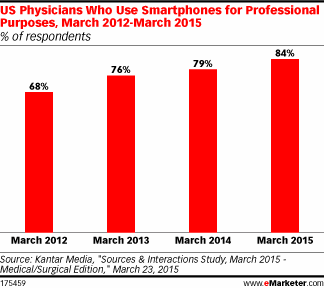
Read MoreMobile Physicians, 2012-2015 [CHART]
Among US physicians polled, 84% reported using smartphones for professional purposes.
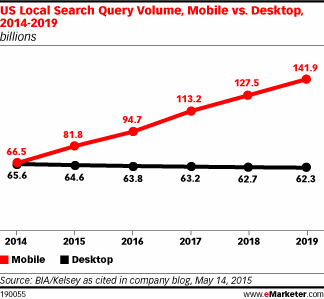
Read MoreMobile vs Desktop US Local Search Volume, 2014-2019 [CHART]
BIA/Kelsey reported that there would be 81.8 billion US local search queries conducted via mobile in 2015, up 23.0% over 2014.
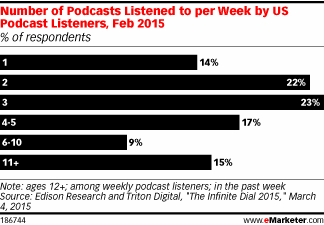
Read MoreNumber Of Podcasts People Listen To Weekly, February 2015 [CHART]
Weekly podcast listeners—estimated at approximately 27 million people—listened to an average of six podcasts per week.
Read More