Mobile Behavior
Smart Phone Activities By Generation, July 2015 [CHART]
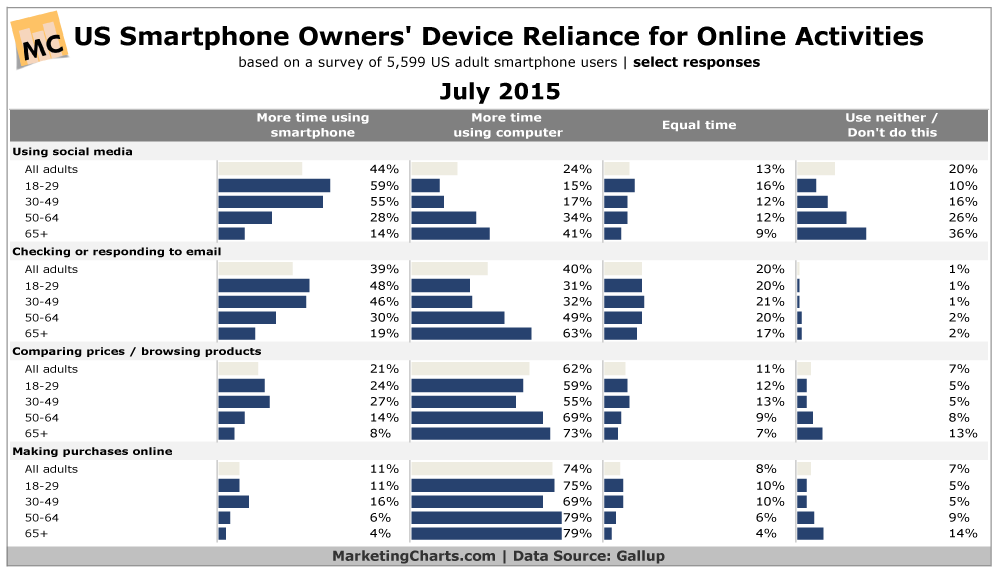
The only activity of those identified for which smartphones are the primary device is social media use.
Read MoreLast Touch Channel Share Of Mobile Visits, 2013-2015 [TABLE]
Once again, search has grown a small amount, up to 44.5% of total referral traffic in 2015.
Read MoreLevel Of Parental Concern Over Child's Mobile Use, August 2015 [CHART]
US parents are concerned about how much time their kids are spending with mobile devices—but still willing to grant mobile usage to their children.
Read MoreFrequency Of Smart Phone Use By Demographic, July 2015 [CHART]
Roughly half of US smartphone owners say they check their phone a few times an hour or every few minutes .
Read More2015 Holiday Shopping Trends [INFOGRAPHIC]
This infographic from think with Google illustrates five holiday shopping trends you’ll want to keep an eye on for the 2015 retail season.
Read MoreMobile Transaction Abandonment, August 2015 [CHART]
A majority (56%) of US smartphone owning adults have abandoned a mobile transaction.
Read MoreTime Spent On Mobile Devices – Apps vs Browser, June 2015 [CHART]
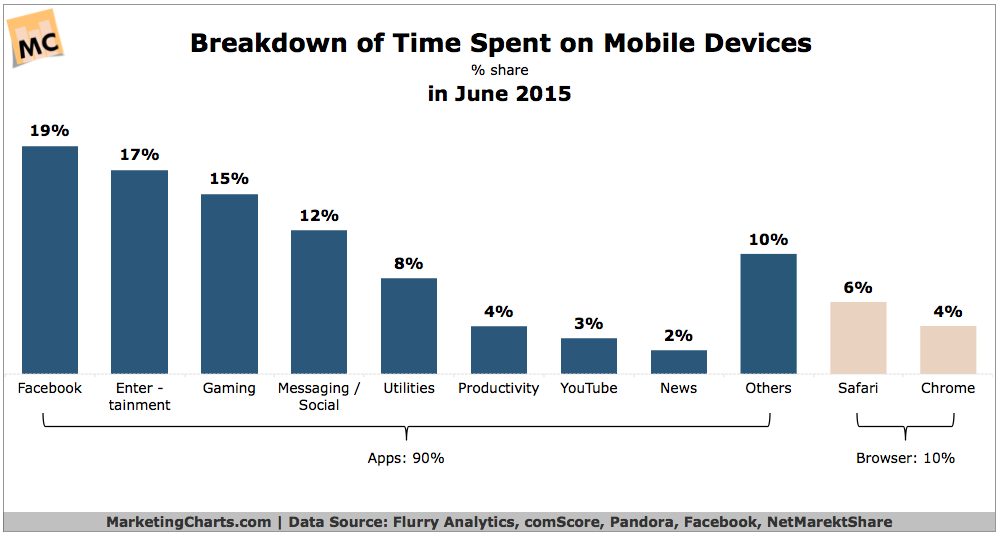
Apps continue to dominate US time spent with mobile, reaching 90% of mobile minutes in June 2015, up from 86% share in Q2 2014.
Read MoreDevices Mothers Use To Check Facebook, 2012-2015 [CHART]
In 2015, 67% of mother Facebook users logged on to the social network via mobile phone, up from 60% in 2014 and just 45% in 2013.
Read MoreKids' Summer Media Consumption, August 2015 [CHART]
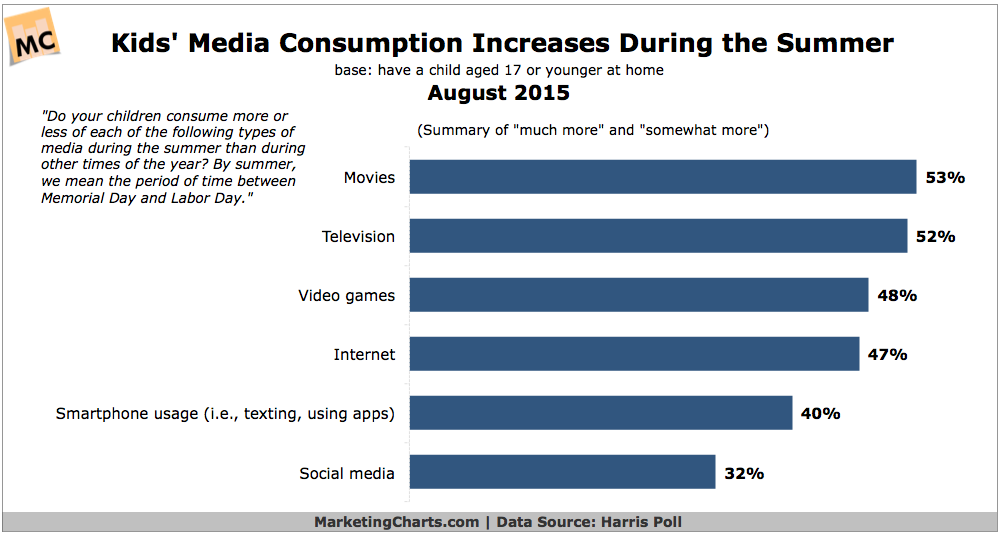
Kids’ media consumption goes up during the summer, particularly when it comes to movies and TV.
Read MoreTime Spent Watching Periscope Videos Per Day, 2015 [CHART]

Periscope users watch an average of 40 years of video per day.
Read More