Mobile Behavior
Mobile Operating System Market Share, 2011 vs 2012 [CHART]
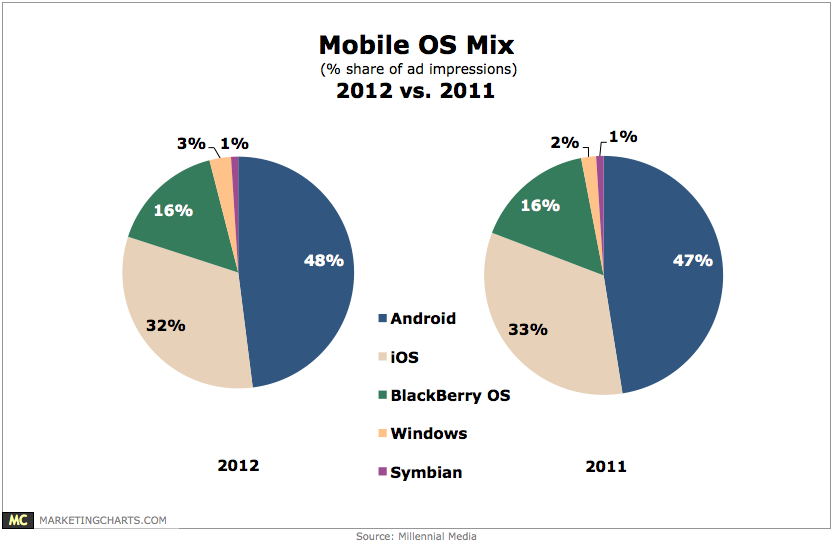
With 75% share of total ad impressions, the smart phone share grew by 7% points from 2011.
Read MoreSearch Advertising Click Share By Device, Q4 2011 – Q4 2012 [CHART]
The share of paid clicks coming from smart phone and tablet devices nearly doubled between Q4 2011 and Q4 2012.
Read MoreHow Mobile Affects Local Marketing Mix [CHART]
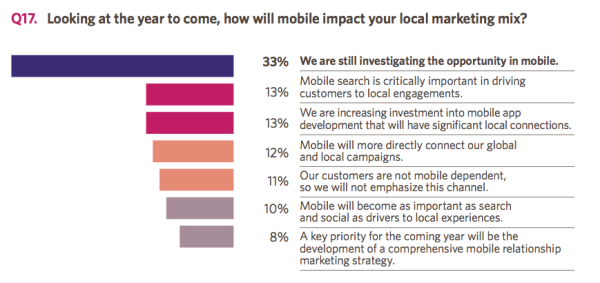
While many brands and retailers have a vague understanding of the importance of localizing their marketing efforts, they simply aren’t doing it effectively — if at all.
Read MoreTop Brands' Use Of Instagram Filters [CHART]
In November, roughly one-half of the brands on Instagram used filters, but that number has reduced over time.
Read More
Mobile Email Opens, 2010-2012 [CHART]
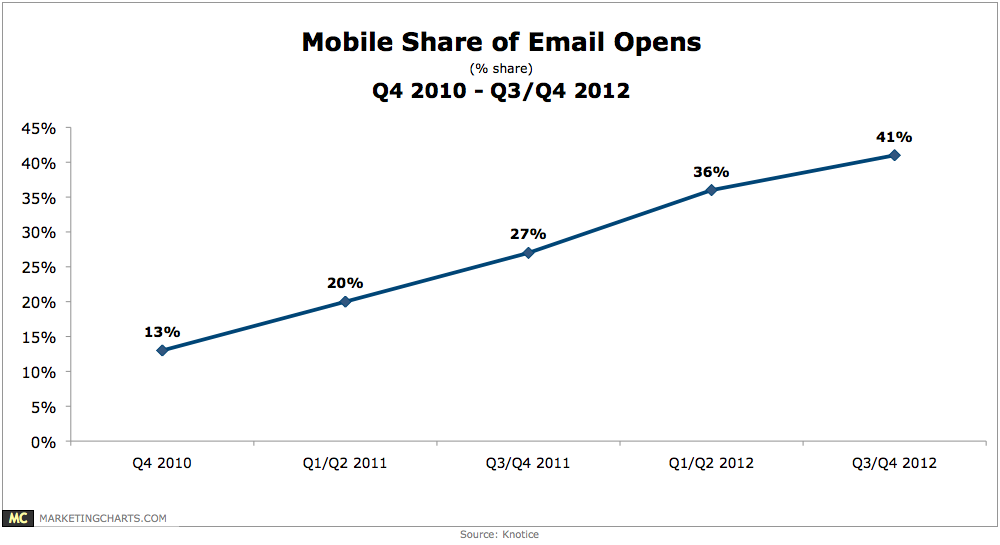
The share of email opens occurring on a mobile device keeps growing, climbing to 41% in the second half (H2) of 2012 from 36% in H1.
Read MoreTop New Developments Affecting Email Marketing, February 2013 [CHART]
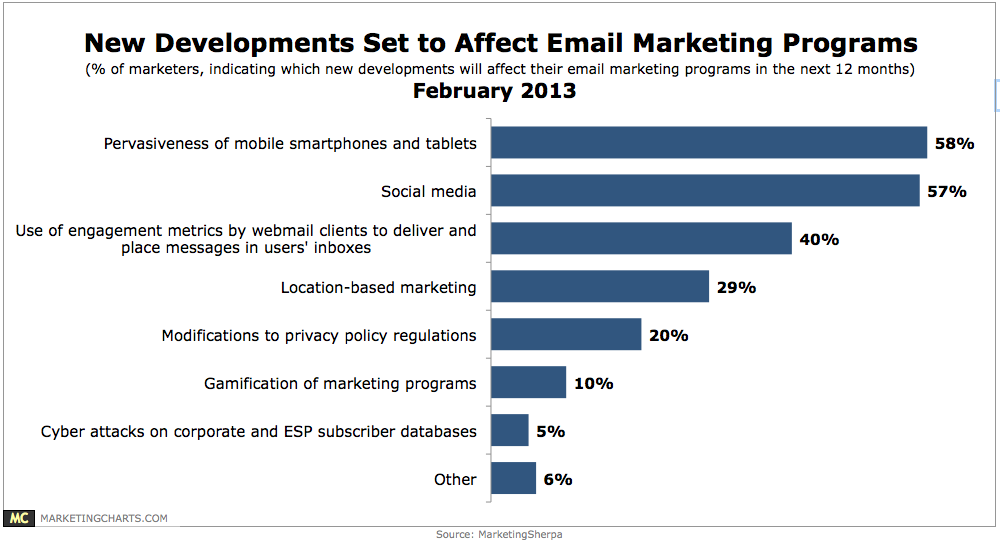
Asked what new developments will affect their email marketing programs in the next 12 months, 58% of marketers cited the pervasiveness of smartphones and tablets, and 57% pointed to social media.
Read MoreGlobal Smart Device Market Penetration By Country, January 2013 [CHART]
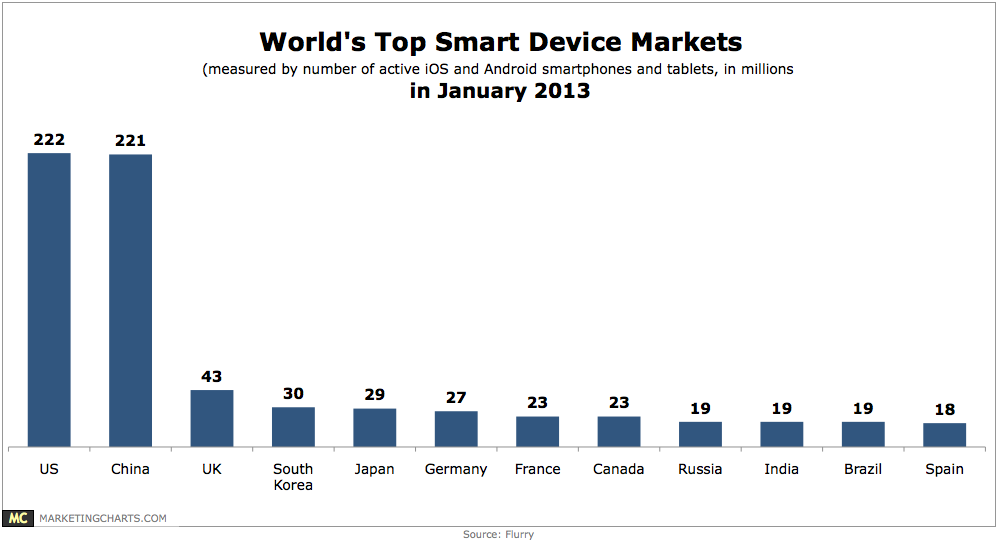
China became the largest market this month, surpassing the US for the first time.
Read MorePreferences For Subscription vs. Ad-Supported Streaming Content By Device, November 2012 [CHART]

Most consumers still prefer free, ad-supported content though those with connected TVs are more likely to like the ad-free subscription model.
Read MoreThe Economic Impact Of Mapping [INFOGRAPHIC]
Google put together this infographic to illustrate some examples of the benefits of maps.
Read More