Mobile Behavior
Time Spent On Mobile Device Online By Activity, Q1 2013 [TABLE]
US mobile internet users spent the greatest percentage of their mobile web time using email, a 23% share of time spent vs. only 5% of time spent on desktop.
Read MoreDevices Used To Go Online, July 2011-January 2013 [CHART]

On average, 43.5% of participants accessed the internet via a mobile phone each week during the period ending in January 2013, an 8-percentage-point increase over the period ending in July 2012.
Read MoreAmerican Mobile Buyers By Device, 2011-2017 [TABLE]
In 2013, 79.4 million US consumers, amounting to 51% of digital buyers, will purchase online using a mobile device.
Read MoreTime Spent On Multitainment Activity, April 2013 [TABLE]
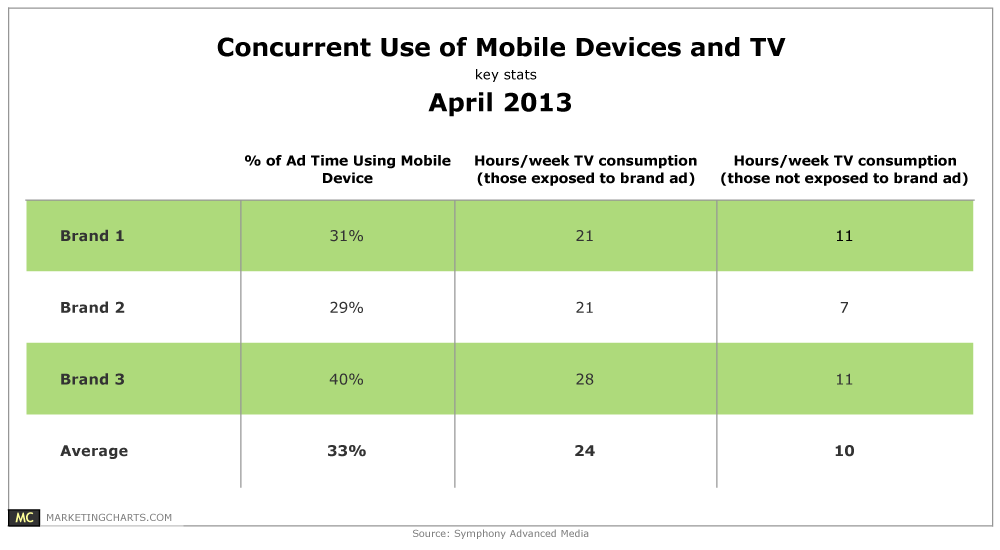
30-40% of actual TV ad viewing occurred concurrently with mobile device usage.
Read MoreMonthly Average CTR For Q1 2013 By Mobile Device [CHART]

Advertisers devoted roughly three-quarters of their budgets to iOS devices during Q1 2013.
Read MoreGlobal mCommerce Interest By Gender, April 2013 [CHART]
Men appear to be more interested in using their mobile phones than women.
Read MoreConsumers & Cross-Channel Retail, April 2013 [TABLE]
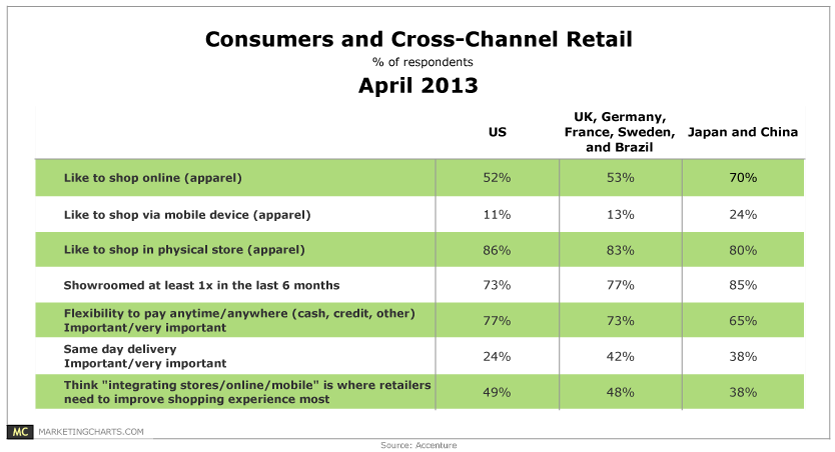
49% of US consumers believe the best thing that retailers can do to improve the shopping experience is to better integrate in-store, online and mobile shopping channels.
Read MoreUS Local Mobile vs Desktop Search Volume, 2011-2016 [CHART]
Google estimated that 20% of searches across all platforms worldwide have local intent.
Read MoreCPG Mobile Advertising Post-Click Actions, 2012 [CHART]
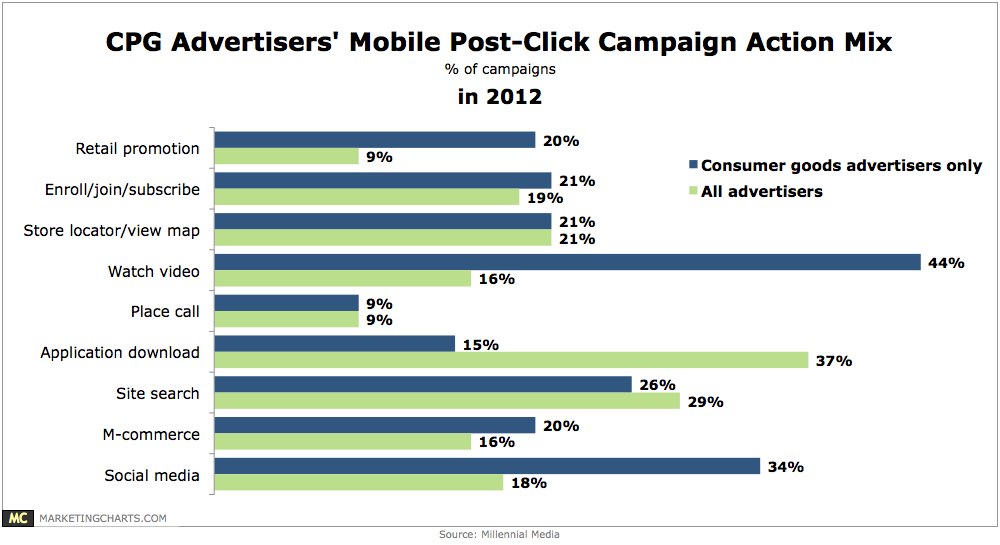
CPG brands were more focused on encouraging consumers to watch video, with 44% of the campaigns incorporating a video aspect (compared to 16% on average).
Read More