Mobile Behavior
Mobile Media Consumption By Gender, March 2013 [CHART]
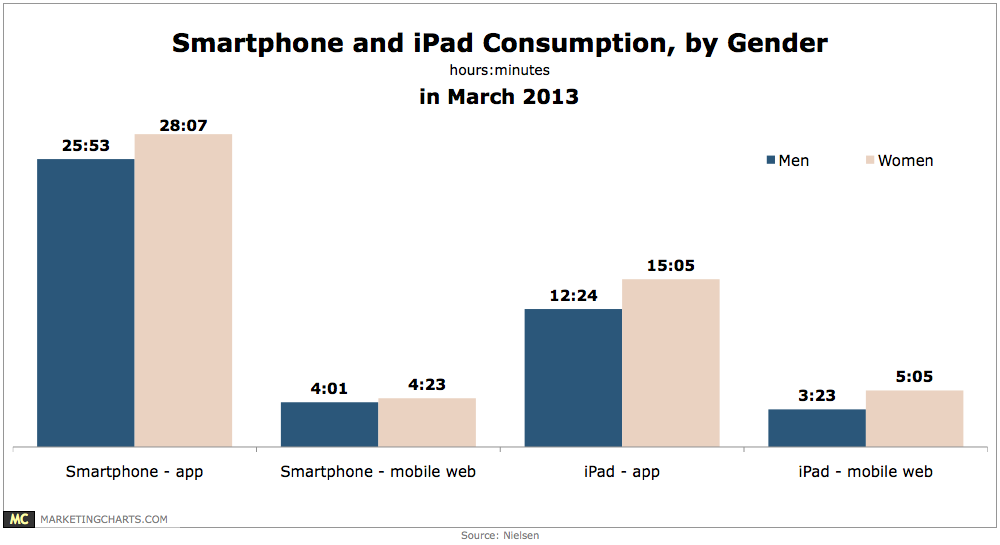
Smart phone users spent just 13% of their time using the mobile web, and iPad users a relatively larger – but still minor – 24%.
Read MoreTV Everywhere & Subscription Television Satisfaction, June 2013 [CHART]
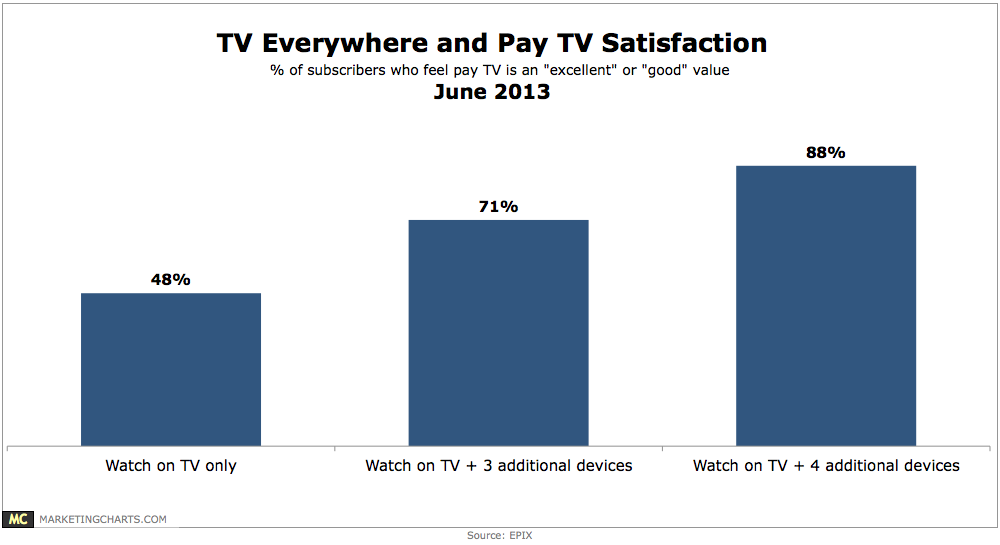
TV Everywhere has yet to reach 50% of America’s multichannel TV subscribers.
Read MoreAmerican Video Gamers By Type, 2013 [CHART]
Just fewer than seven out of 10 US residents had ever played video or computer games.
Read MoreAverage Global Hotel Website Pageviews/Visit by Device, Q4 2012 [CHART]
Tablet users spent much more time on hotel websites, viewing an average of 4.9 pages per visit in Q4 2012, approximately the same as PC users.
Read MoreGlobal Hotel Website Visits By Device, Q4 2012 [CHART]
Google predicted that US hotel searches would be up 24% in 2013 overall, but that includes a 68% uptick in searches from mobile devices against a 4% decrease in desktop queries.
Read MoreAmerican Tablet Adoption Rates By Demographic, May 2013 [CHART]
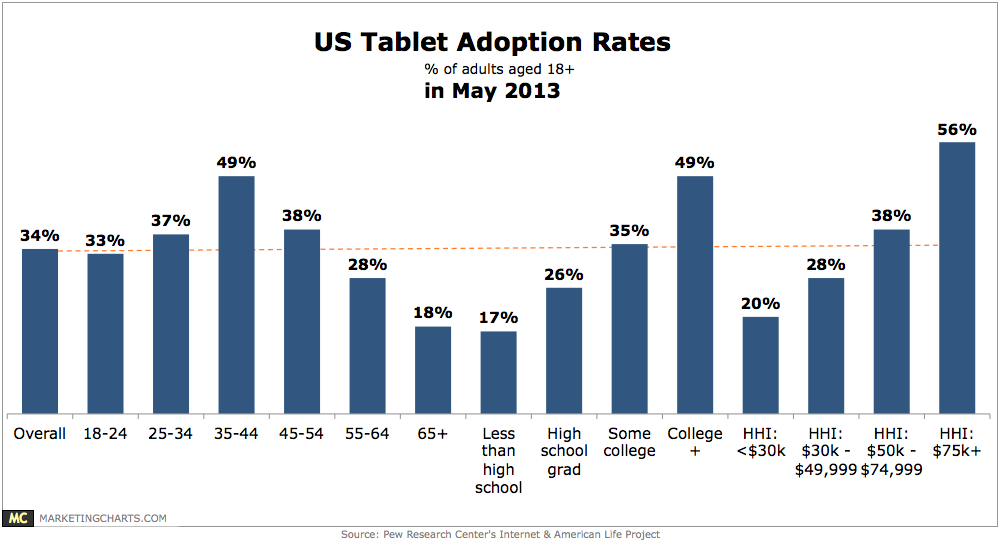
Pew’s Internet & American Life Project found 34% of American adults reporting ownership of a tablet, almost double the 18% adoption rate it found in a survey fielded in April 2012.
Read MoreLGBT Mobile Shopping Activities, June 2013 [CHART]
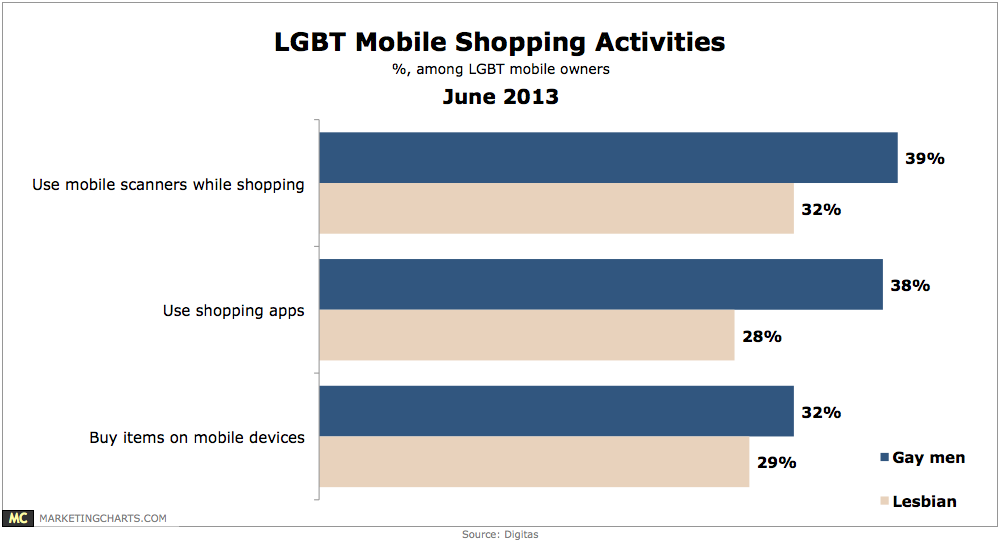
Men are more likely than women to engage in a variety of mobile shopping activities, with gay men more likely to: use mobile scanners while shopping (39% vs. 32%).
Read MoreGlobal Mobile Payment Transactions By Device, June 2012 vs April 2013 [CHART]
Europe sports the world’s largest percentage of transactions made using a mobile device, at 15.3%, followed by Asia (12.4%) and North America (11.2%).
Read MoreUS Vehicle Shoppers Who Have Visited An Auto Website On Smart Phone, 2010-2012 [CHART]
The percentage of in-market shoppers who visited an automotive website from their smart phone increased from 17% in 2010 to 31% in 2012.
Read MoreAmerican Sports Content Consumption [INFOGRAPHIC]
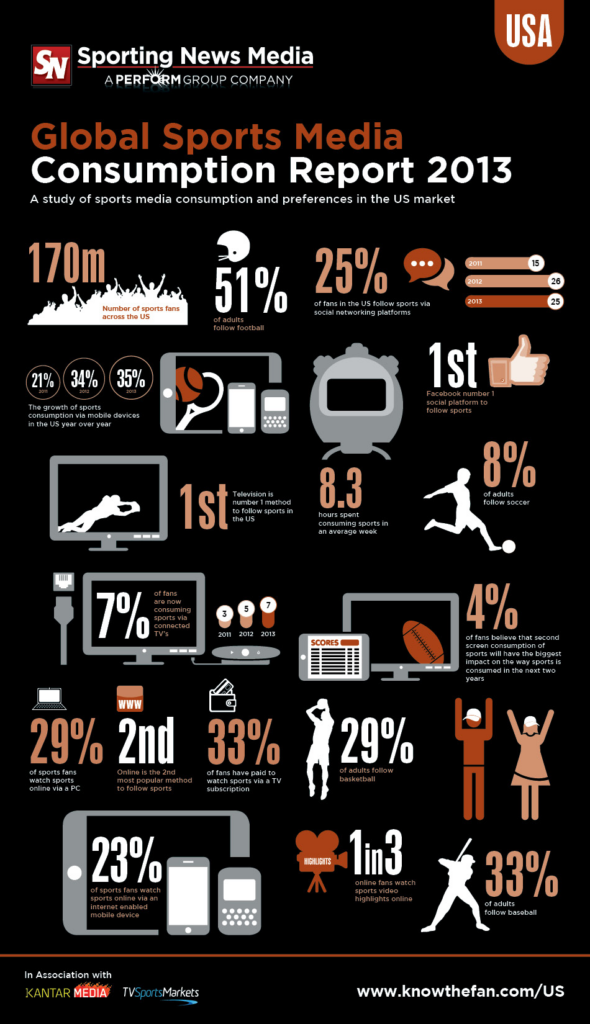
25% of sports fans use social media to follow leagues, teams and players online.
Read More