Mobile Advertising
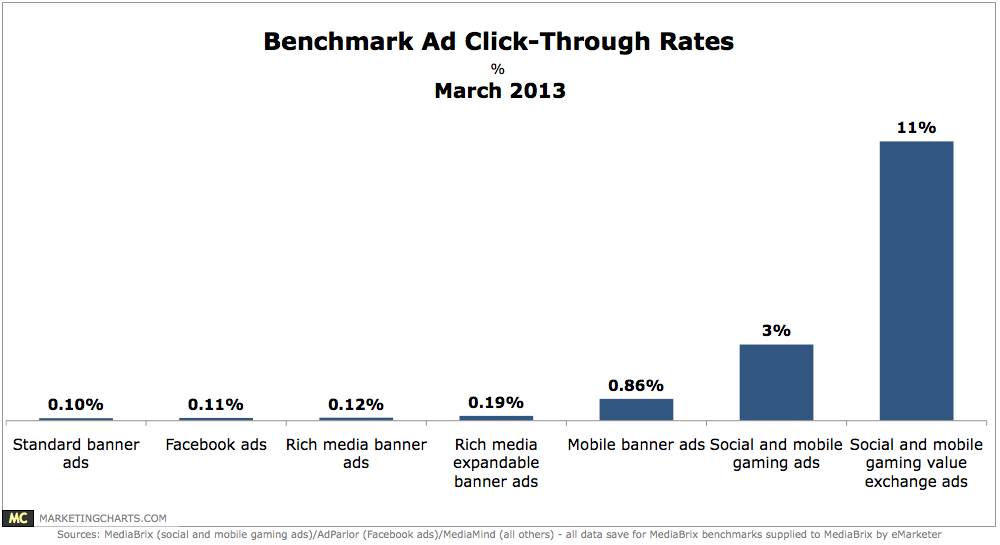
Advertising Click-Through Rate Benchmarks, March 2013 [CHART]
Social and mobile gaming ads generate an average click-through rate (CTR) of 3%.
Read MoreBreakdown Of Top Brands Digital Marketing Budgets, December 2012 [CHART]
65% of top US brands reported participating in influencer marketing.
Read MoreConsumer Attitudes Worldwide Toward Mobile Advertising, February 2013 [CHART]
This chart from Nielsen is a snapshot of consumer attitudes worldwide toward mobile advertising.
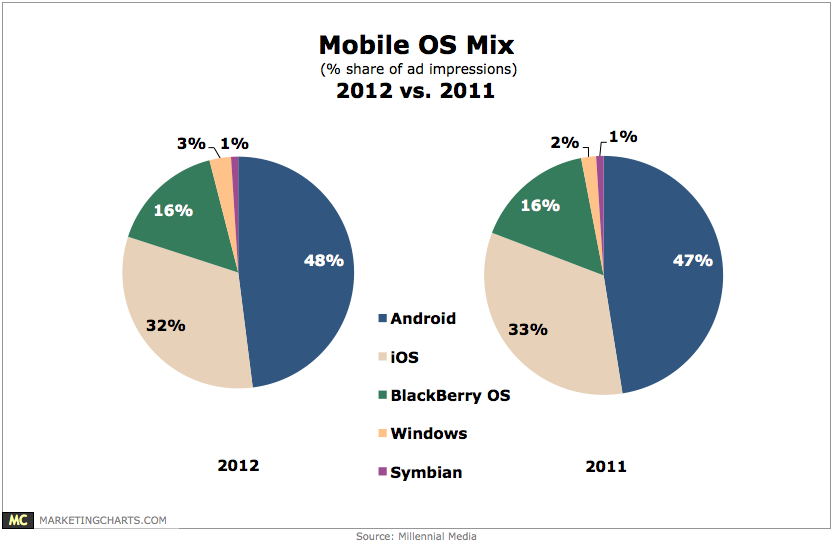
Read MoreMobile Operating System Market Share, 2011 vs 2012 [CHART]
With 75% share of total ad impressions, the smart phone share grew by 7% points from 2011.
Read MoreSearch Advertising Cost Per Click By Device, Q4 2011 – Q4 2012 [TABLE]
US advertisers will increase mobile search ad spending 80.6% this year to $3.54 billion, up from $1.99 billion in 2012.
Read MoreSearch Ad Spending Share By Device & Search Engine, Q4 2011 – Q4 2012 [TABLE]
On desktops, Google captured more than four-fifths of search spending in the last quarter measured.
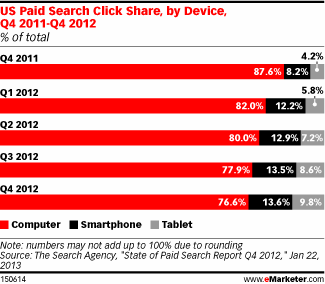
Read MoreSearch Advertising Click Share By Device, Q4 2011 – Q4 2012 [CHART]
The share of paid clicks coming from smart phone and tablet devices nearly doubled between Q4 2011 and Q4 2012.
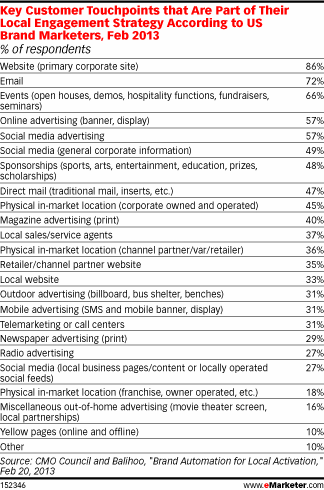
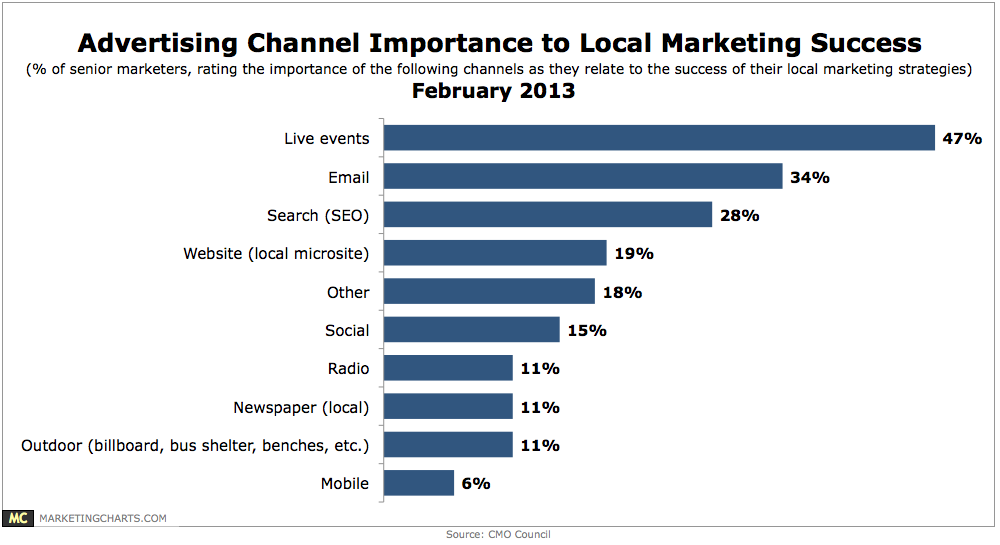
Read MoreTop Channels For Local Marketing Success, February 2013 [CHART]
Senior marketers are lukewarm about mobile’s importance to their local marketing agendas.
Read More
