Mobile Advertising
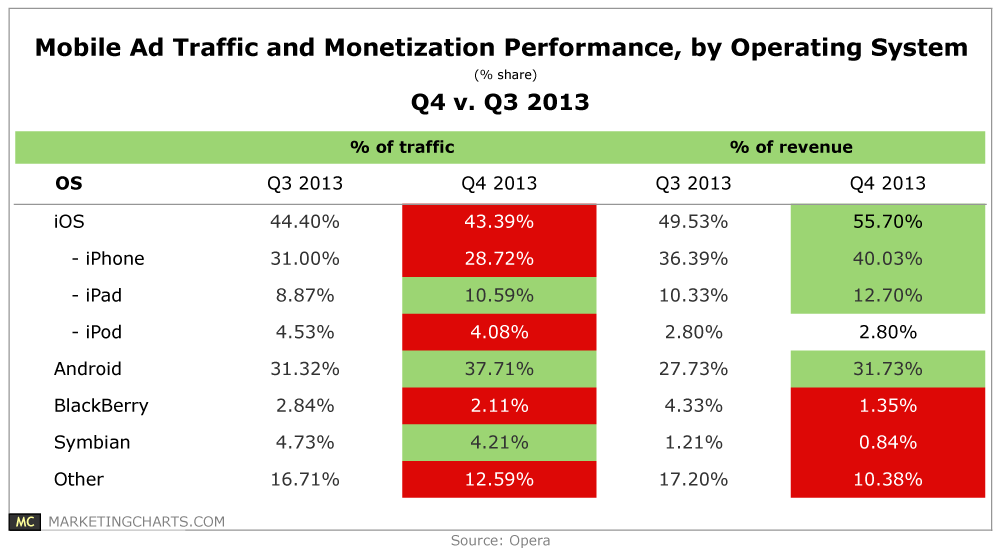
Mobile Ad Traffic & Monetization Performance By OS, Q3 vs Q4 2013 [TABLE]
Android phones may have pulled ahead of iPhones in Q4 mobile phone ad traffic share.
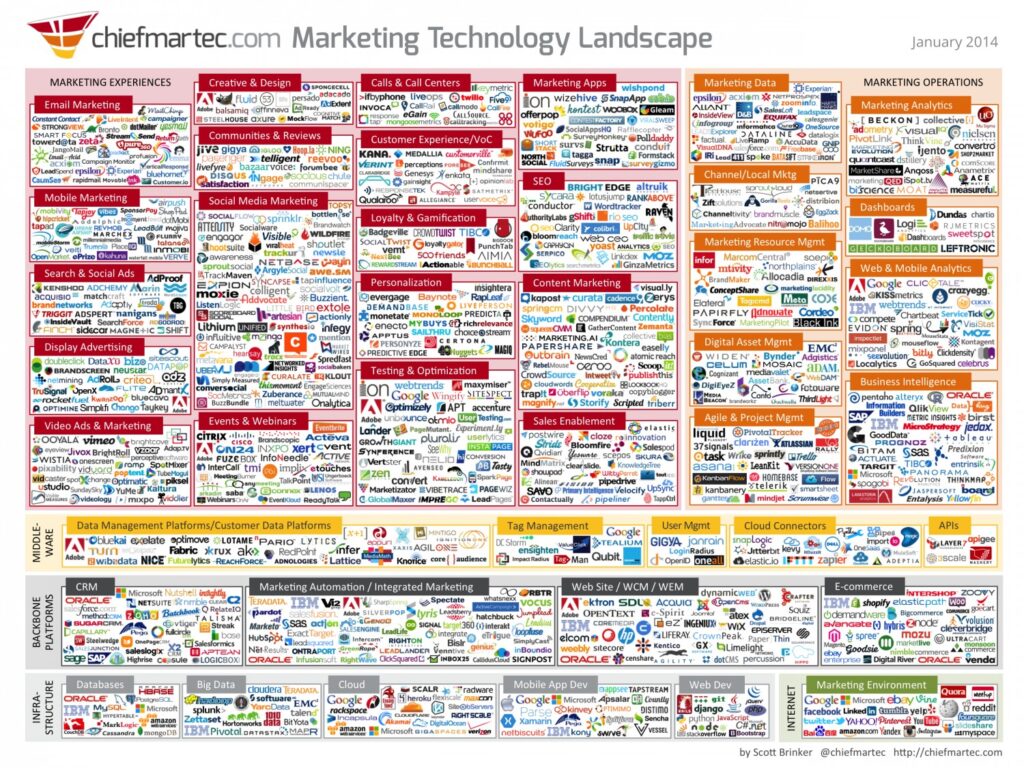
Read More2014 Marketing Technology Landscape [INFOGRAPHIC]
This infographic illustrates the marketing technology universe with 947 different companies that provide software for marketers.
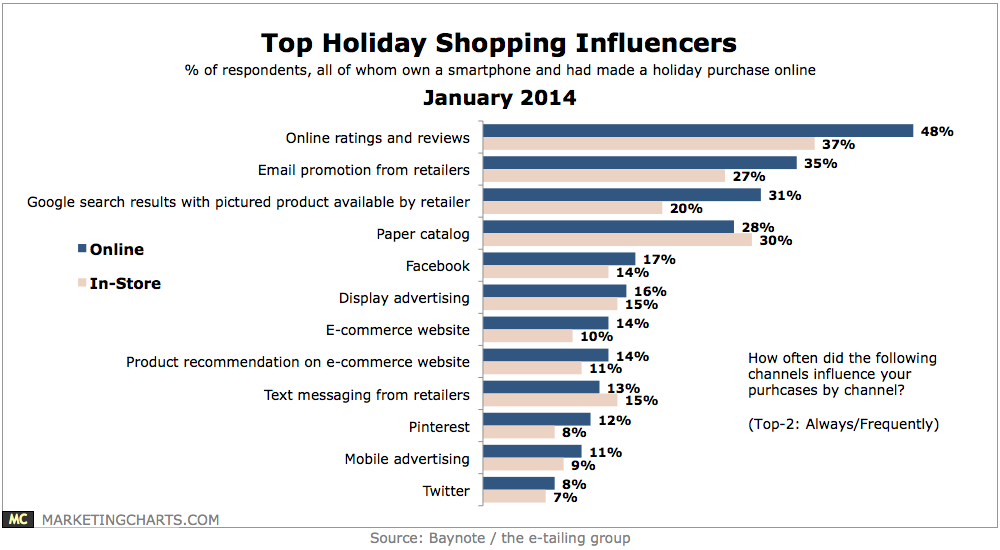
Read MoreTop Influences Over Holiday Shopping, January 2014 [CHART]
48% said online ratings and reviews frequently or always influenced their online purchases, and 37% said the same about their in-store purchases.
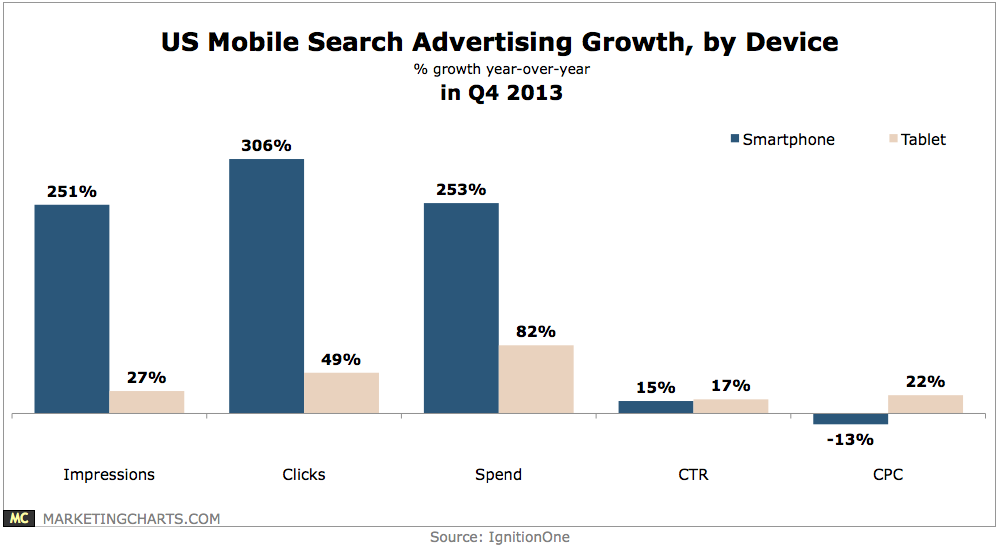
Read MoreUS Mobile Search Advertising Growth By Device, Q4 2013 [CHART]
Search ad spending on smartphones soared by 253% year-over-year, while spending on tablets grew by a relatively smaller 82%, as advertisers’ targeting options were limited by Enhanced Campaigns.
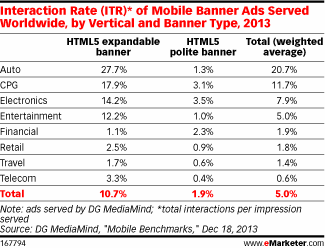
Read MoreGlobal Mobile Banner Ad Interaction Rates, 2013 [TABLE]
Mobile expandable banners had greater success in engaging customers than polite banners across almost all verticals.
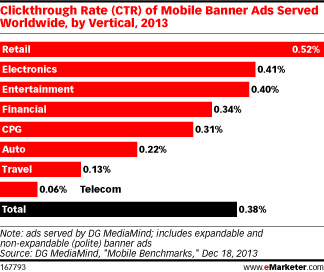
Read MoreGlobal Mobile Ad Click-Through Rates By Vertical, 2013 [CHART]
Mobile ads in the retail and electronics categories had the highest clickthrough rates (CTRs), at 0.52% and 0.41%, respectively.
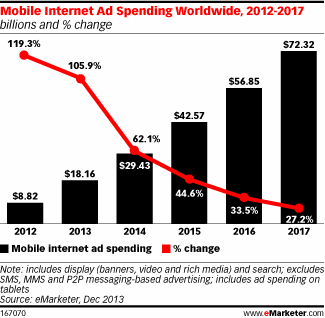
Read MoreGlobal Mobile Ad Spending, 2012-2017 [CHART]
The No. 1 goal of mobile ad campaigns worldwide in Q3 was to increase mobile traffic to a site, chosen by 34% of respondents.
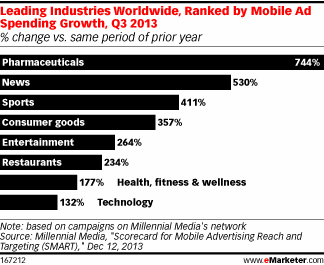
Read MoreGlobal Mobile Ad Spending Growth By Industry, Q3 2013 [CHART]
The pharmaceutical industry has done the most to increase mobile ad spending as of Q3 2013.
Read More2014 Marketing Budget Plans By Channel [CHART]
9 in 10 business leaders plan to either increase (46%) or maintain (47%) their marketing budgets in 2014.
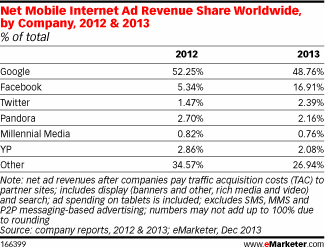
Read MoreGlobal Net Mobile Ad Revenue Share By Company, 2012 & 2013 [TABLE]
Globally, Google dominates the mobile ad landscape, with a 48.76% market share.
Read More