Mobile Advertising
UK Mobile Ad Spending By Format, 2012 & 2013 [TABLE]
Growth in display ad spending within the mobile space is even more pronounced than in the overall ad spend equation—IAB UK and PwC indicated an increase of 180.0% in the UK in 2013.
Read MoreWestern European Mobile Online Ad Spending Share By Share, 2012-2018 [TABLE]
UK mobile ad spending grew 126.1% in 2013 to account for 19.0% of all digital ad spending in the country; this proportion will increase to 31.9% in 2014.
Read MoreUS Local Media Revenue Forecast, 2013 & 2018 [CHART]
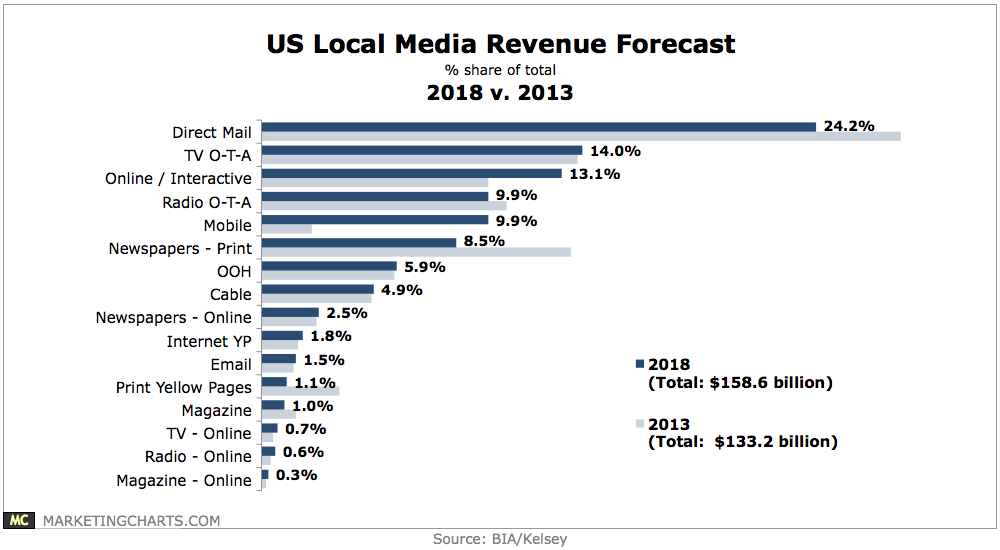
Local media revenues are expected to increase from $133.2 billion last year to $158.6 billion in 2018.
Read MoreMobile Video Ad Benchmarks By Length & Format, April 2014 [CHART]
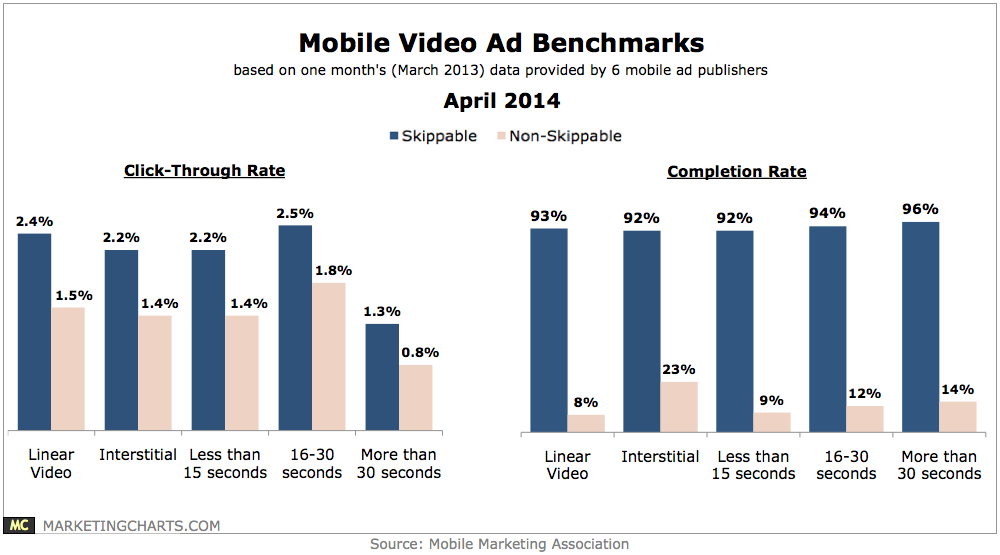
Completion rates for non-skippable video ads topped 90% for each of the formats measured – linear video (93%); interstitial (92%); and value exchange (97%).
Read MoreMobile Display Ad Effectiveness Grades, March 2014 [CHART]
eMarketer estimates steep growth (82.3%) in the amount spent on mobile display advertising in the US this year.
Read MoreGlobal Marketing Budget Sentiment By Medium, April 2014 [CHART]
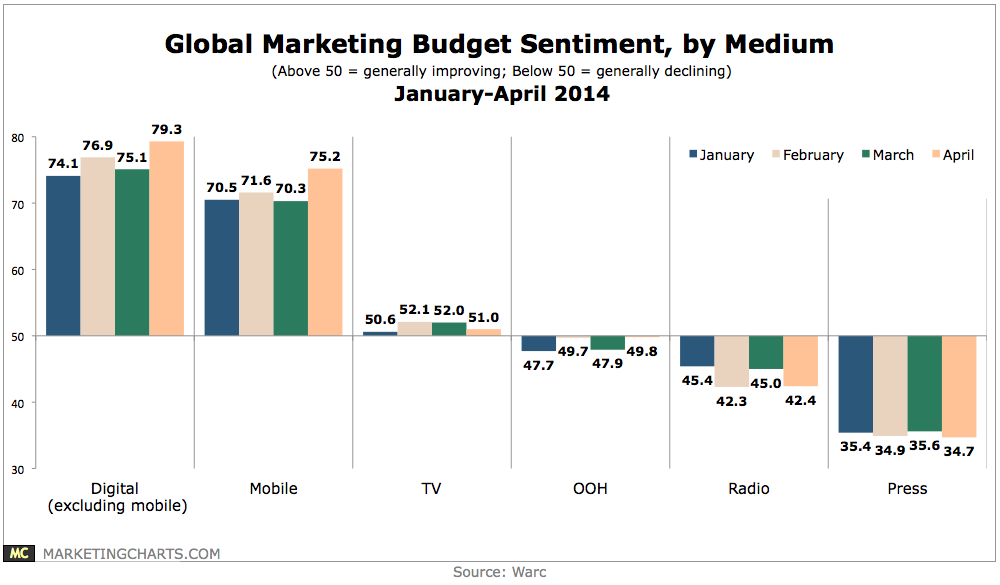
Not surprisingly, digital (excluding mobile) marketing budget expectations have been rapidly increasing throughout the first 4 months of the year, although it’s surprising to see them slightly exceed mobile budget optimism.
Read MoreAd Spending In Sweden By Media, 2013 [TABLE]
Ad spending on daily newspapers dropped 13.4%, and magazines saw a 14.5% decline.
Read MoreConsumption-Adjusted Ad Spend On Major Media, 2010-2014 [CHART]
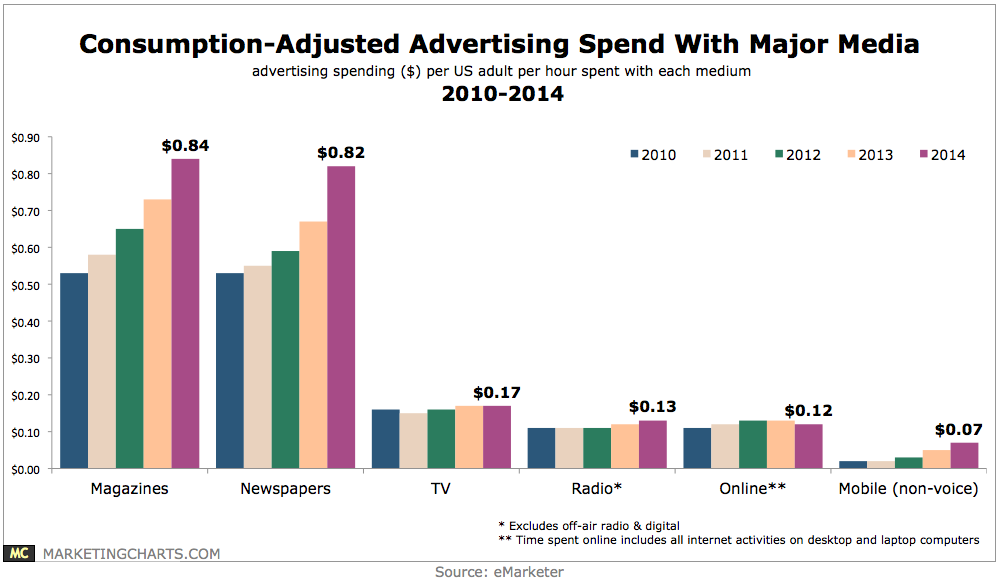
US advertisers are projected to spend 7 cents for every hour a US adult spends on connected mobile activities this year.
Read MoreFacebook’s Mobile Monthly Users & Ad Revenues, Q3 2012 – Q1 2014 [CHART]
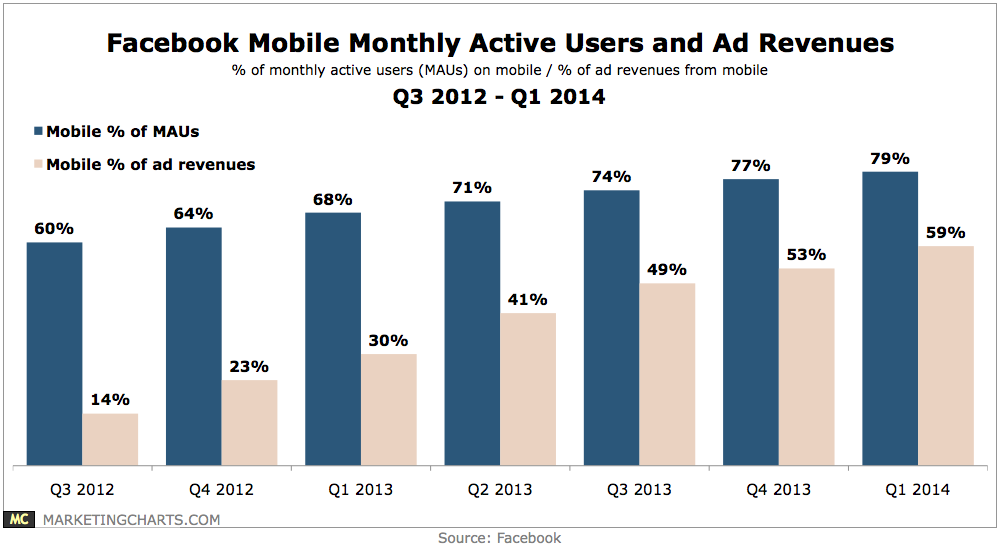
Facebook says it now has more than 1 billion mobile monthly active users to go with WhatsApp’s 500 million users and Instagram’s 200 million.
Read MoreMobile Ad Traffic & Monetization By OS, Q4 2013 vs Q4 2014 [TABLE]
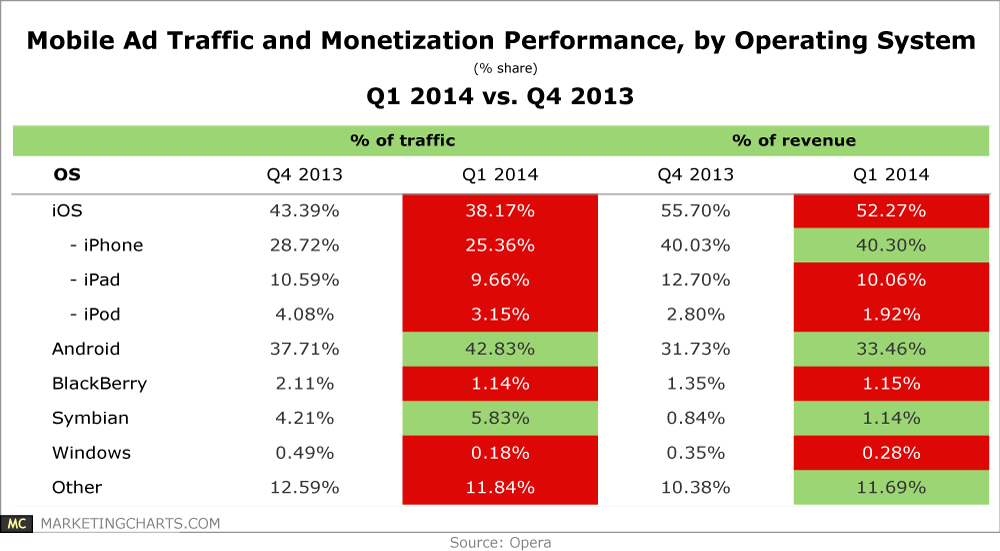
Android took over as the top smart device platform on the Opera Mediaworks platform in Q1, with about 43% of traffic, versus 38% for iOS devices.
Read More