Millennials
Americans’ Favorite Media Activities By Generation, March 2013 [CHART]

64% of Americans rank watching TV (on any device) as one of their top-3 media activities, down from a high of 71% in 2009 and 2010 but enough to keep TV viewing as America’s favorite media activity.
Read MoreDemographics Of US Hispanic Social Media Users, October 2012 [TABLE]
Latino social networking penetration among internet users reached 68% last year.
Read More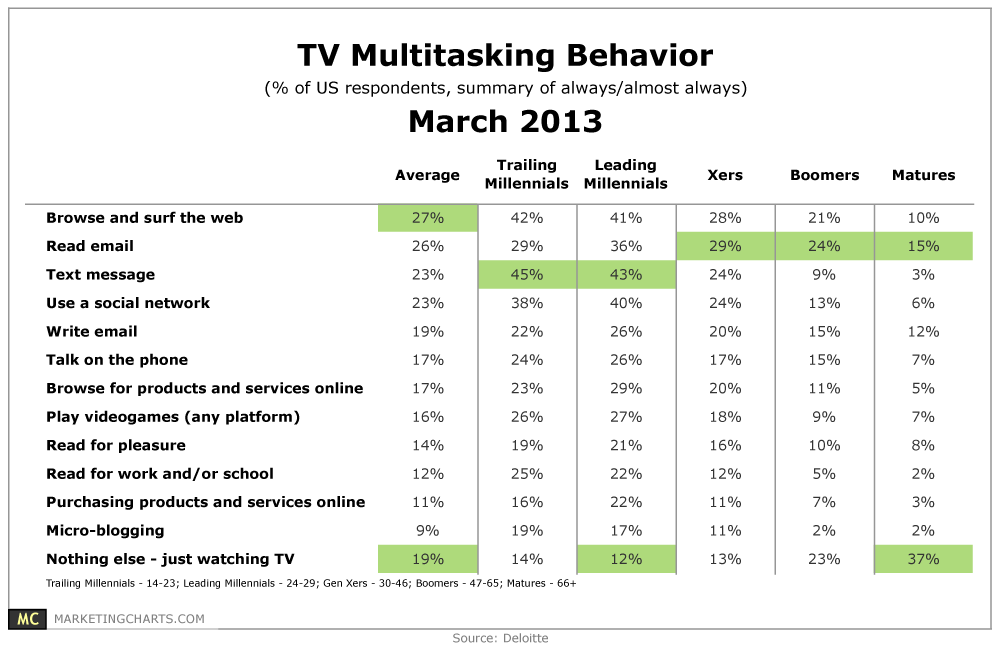
Millennial Technographics, 2012 [CHART]
Millennials make up more than half of all US Twitter users, and will hover around that point for the next several years.
Read MoreMillennial Mobile Phone Users, 2012 [CHART]
92.3% of Millennials used a mobile phone in 2012, among whom 63.2% used the mobile web and slightly fewer used smart phones.
Read MoreTwitter Buzz & TV Ratings, March 2013 [CHART]
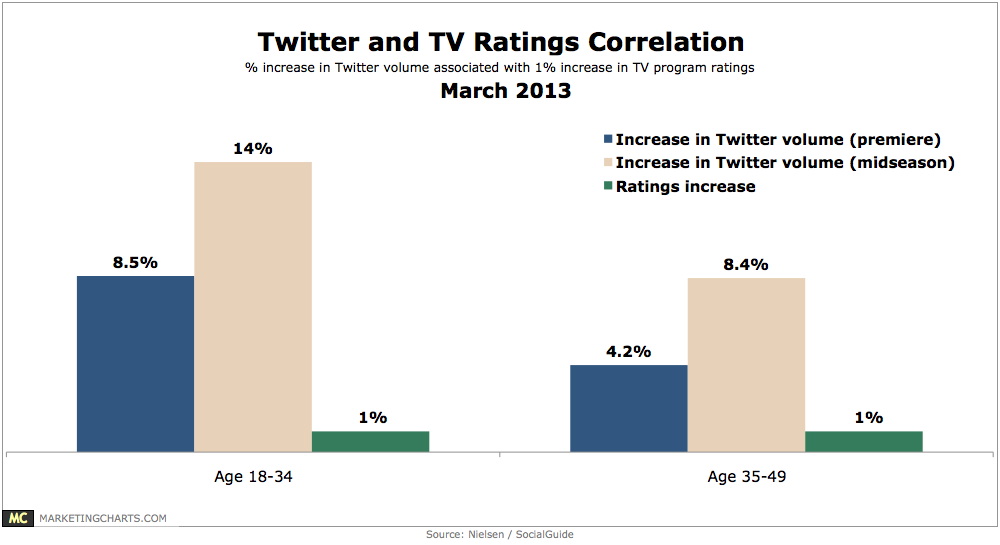
For 18-34-year-olds, an 8.5% rise in Twitter volume corresponds with a 1% increase in TV ratings for premiere episodes.
Read MoreMillennial Early Adopters' Media Use, March 2013 [CHART]
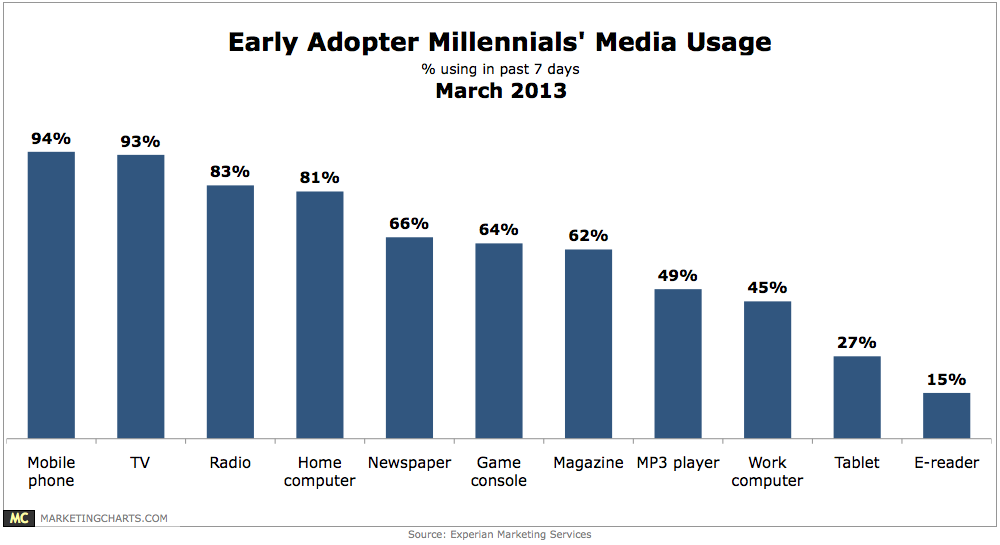
52% of Millennials are above-average in terms of their adoption of technology, and these early adopters are heavily reliant on their mobile devices.
Read MoreCustomer Service Channels & Expectations, March 2013 [TABLE]
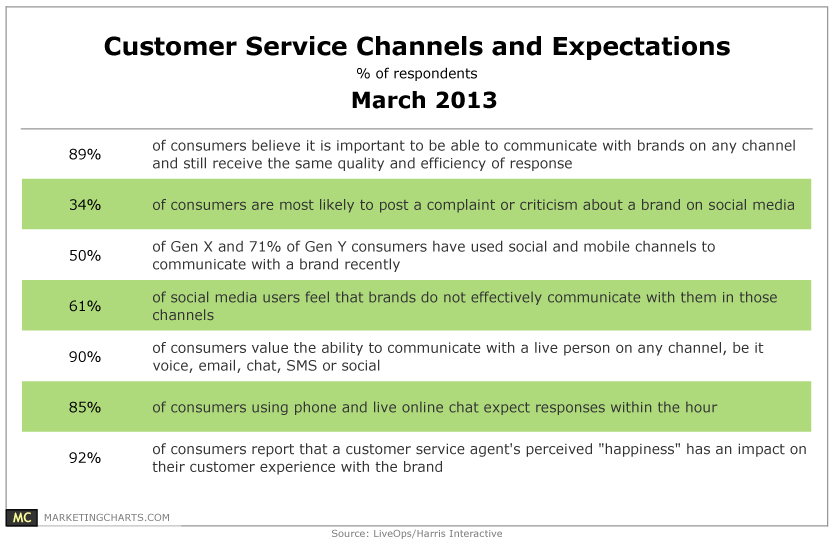
Customer service channels are evolving, but 89% of consumers believe it’s important to be able to communicate with brands on any channel and still receive the same quality and efficiency of response.
Read MoreTraditional Television Viewing By Generation, Q1 2011 – Q4 2012 [TABLE]
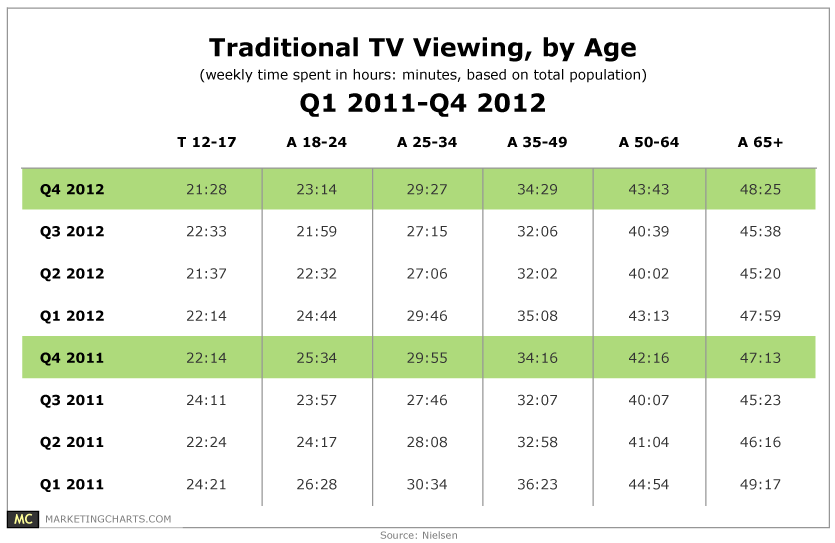
Traditional television consumption is dropping by a larger amount every quarter, but it’s still not a seismic shift.
Read More