Millennials
Demographics Of LinkedIn Users
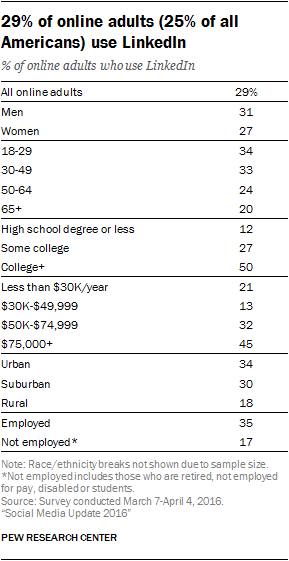
The share of online adults who use LinkedIn has remained steady over the past year: 29% report using the site, similar to the 25% who said this in 2015.
Read MoreTrust In Various Institutions To Safeguard Personal Data [CHART]
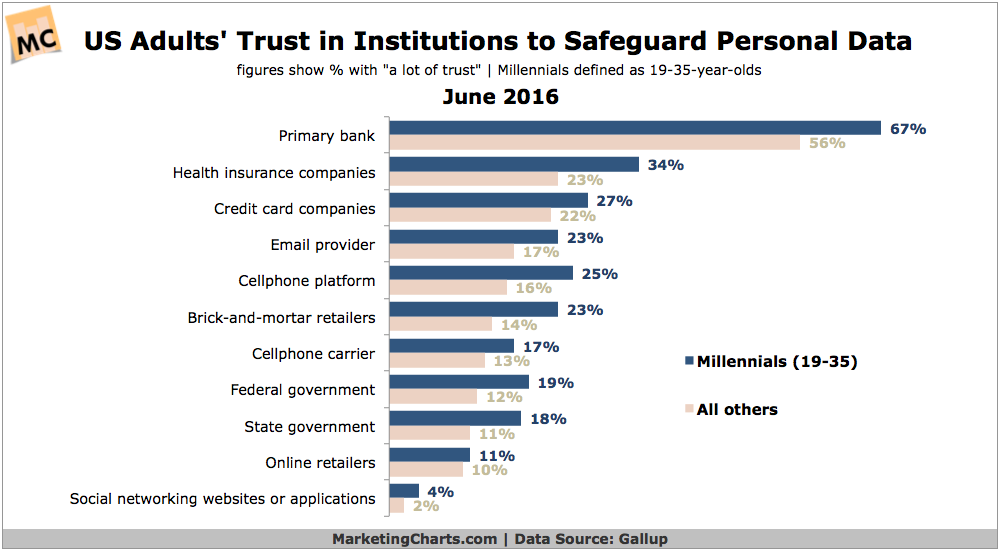
Millennials (19-35) tend to be more trusting than older generations when it comes to institutions safeguarding their personal data.
Read MoreDemographics Of Twitter Users
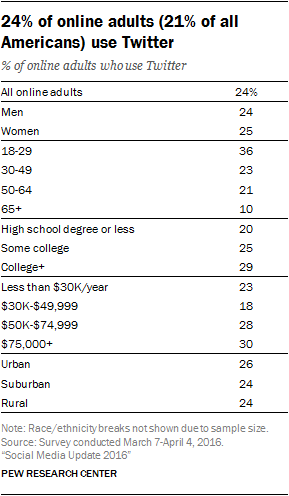
Roughly one-quarter of online adults (24%) use Twitter, a proportion that is statistically unchanged from a survey conducted in 2015 (23%).
Read MoreDemographics Of Instagram Users [TABLE]
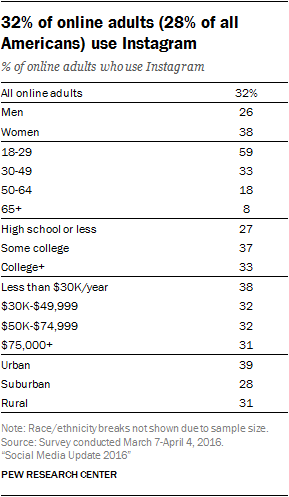
Around one-third of online adults (32%) report using Instagram – roughly the same share as in 2015, when 27% of online adults did so.
Read MoreDigital Device Addiction By Age [CHART]
More than half of internet users are addicted to their digital devices—and it’s most common among younger users.
Read MoreDemographics Of Facebook Users [TABLE]
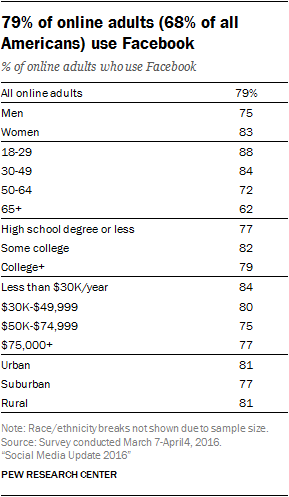
Roughly eight-in-ten online Americans (79%) now use Facebook, a 7-percentage-point increase from a survey conducted at a similar point in 2015.
Read MoreUS Snapchat Users By Age [CHART]
![US Snapchat Users By Age - 2014-2020 [CHART]](https://e-strategy.com/wp-content/uploads/2016/11/US-Snapchat-Users-by-Age-2014-2020.png)
Snapchat’s US monthly user base is projected to grow by 27.2% this year to 58.6 million.
Read MoreDemographics Of Mobile Payment Users [CHART]
![Demographics Of Mobile Payment Users [CHART]](https://e-strategy.com/wp-content/uploads/2016/10/Demographics-Mobile-Payments-Users.png)
Mobile payment users tend to skew young, with more than 7 in 10 belonging to the Millennial (39%) or Gen X (33%) generations.
Read MoreFacebook Live Video Awareness [CHART]
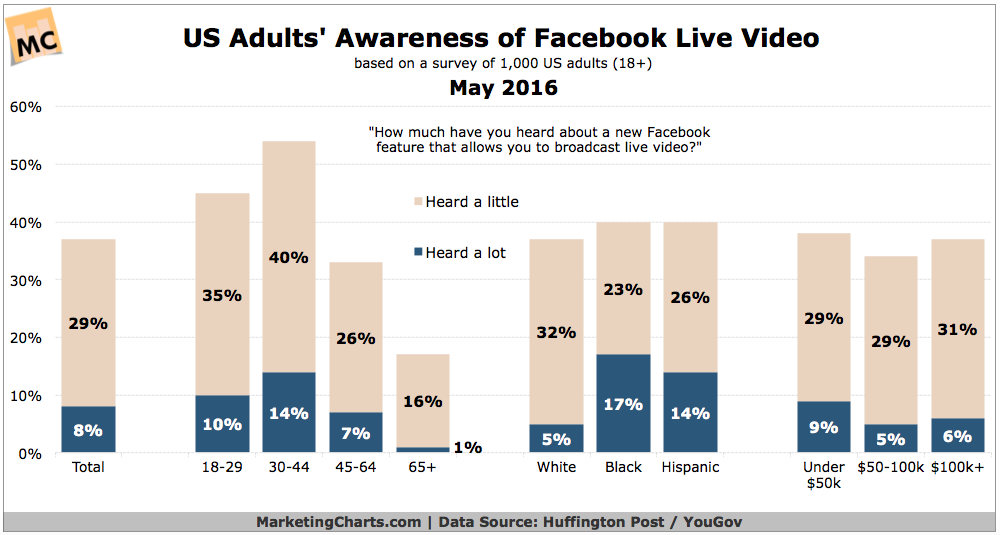
Some 37% of US adults have heard about Facebook’s new feature allowing them to broadcast live video.
Read MoreWeekly Time Spent With Select Media [TABLE]
US consumers spend an average of 35 hours per week watching live and timeshifted television.
Read More