Media Consumption
eSports Viewers, 2018-2023 [CHART]
eSports viewership has grown from 25.7 million viewers in 2018 to 30.3 million in 2019 to a projected 46.2 million in 2023, accounting for 15.5% of internet users at that time.
Read MoreMedia Consumption By Device Age Range [CHART]
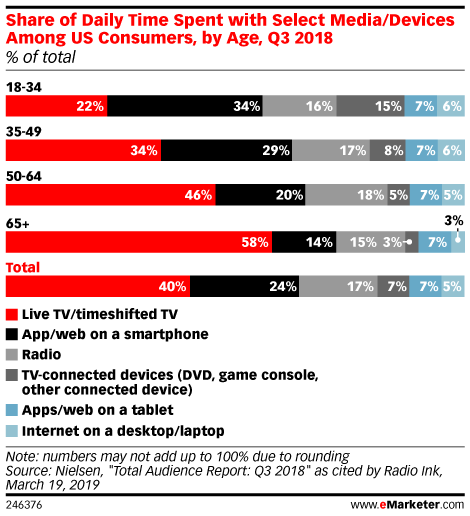
According to Q3 2018 research from Nielsen, US consumers ages 35 to 49 spend nearly the same amount of time with old media like live and timeshifted TV and radio, as with their digital devices by accessing apps and the web on a smartphones or tablet.
Read MoreVoice Assistant User Penetration [CHART]
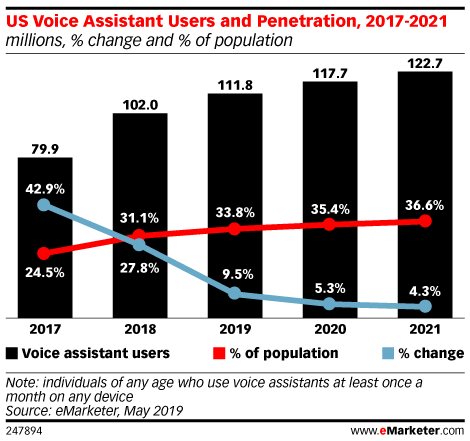
In 2017, nearly 80 million Americans used a voice assistant at least once a month on any device; that number is expected to reach 123 million by 2021, constituting 36.6% of the United States population, according to eMarketer.
Read MoreWeekly Commercial Message Consumption Frequency [CHART]
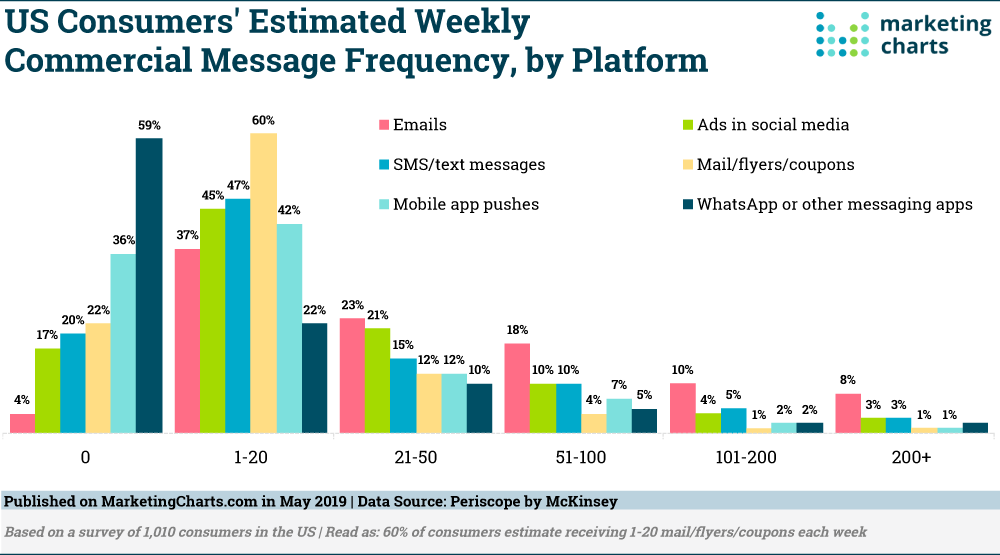
While very few marketers would dispute the effectiveness of personalization, there are still barriers to being able to personalize at scale, namely the time and cost involved in creating personalized content. A survey of more than 1,000 US consumers from Periscope by McKinsey shares some insights on personalized messages and what consumers think of them.
Read MoreWeekly Podcast Listening Frequency [CHART]
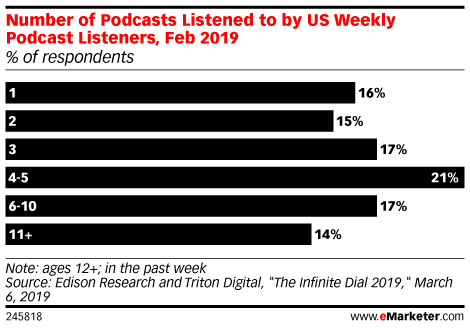
While podcast listeners may still be in the minority (76.4 million people in the US will listen to podcasts this year, or one-quarter of the population), surveys have found that among weekly listeners, most are listening to several podcasts a week.
Read MoreConnected TV Users, 2017-2021 [CHART]
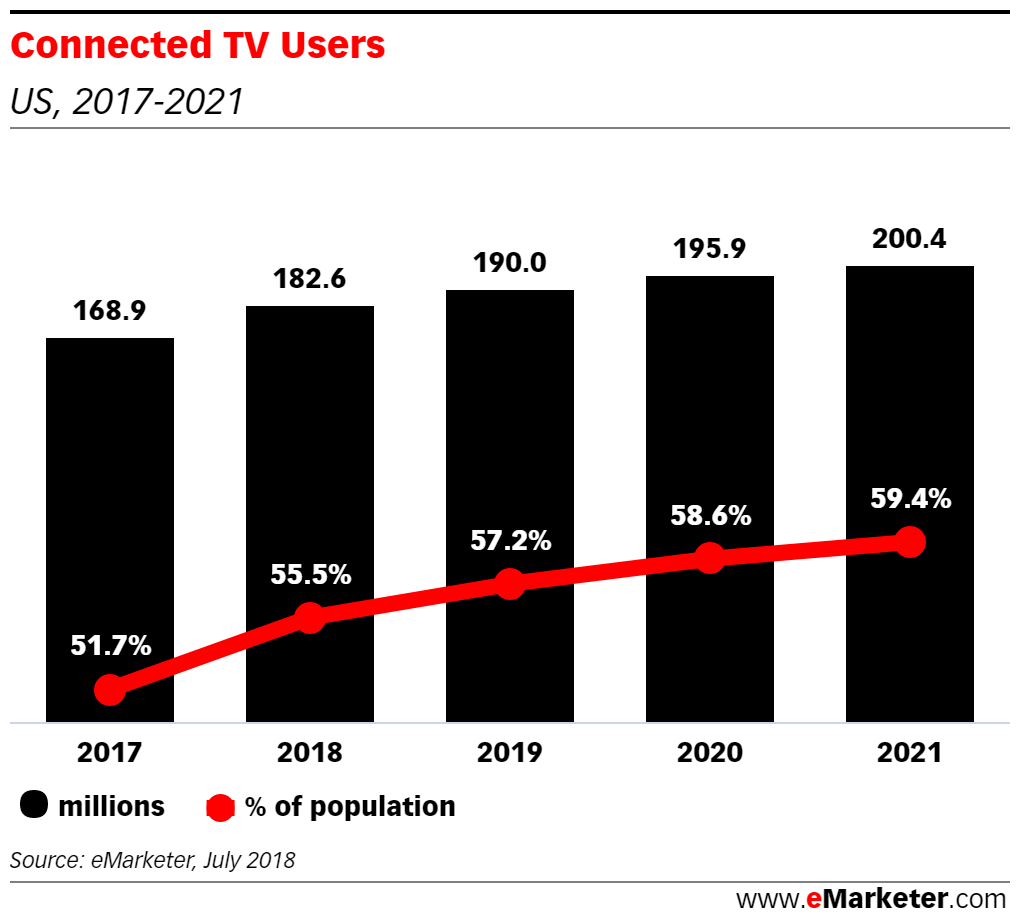
eMarketer expects that more than half of the US population (57.2%) will watch connected TV in 2019, up from 51.7% in 2017, and because the time they spend watching will increase too, the amount of connected TV inventory available to advertisers will proliferate.
Read MoreAverage Household Streaming Video Subscriptions, 2015-2018 [CHART]
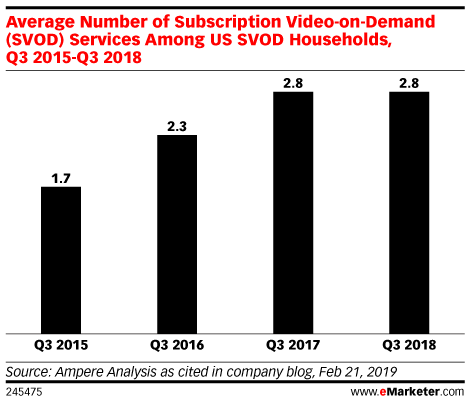
Many Americans believe they will use more subscription services in the future. But when it comes to video streaming, more options doesn’t mean consumers will drastically increase the number of services they’re willing to pay for.
Read MoreAverage Time Spent On TV & Mobile Devices, 2014-2021 [CHART]
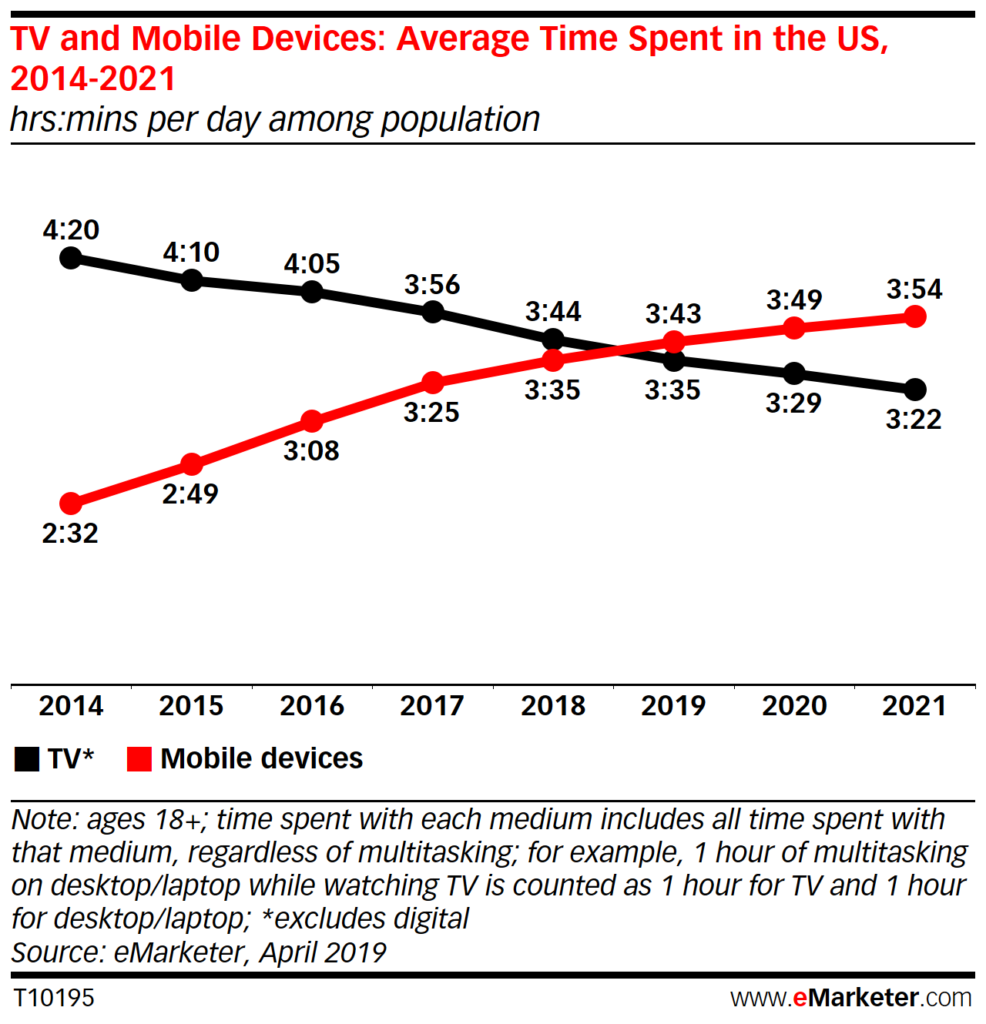
Consumers’ use of smartphones will continue to make up the majority of their media consumption, but that use will plateau by 2020, as consumers become increasingly uneasy about overuse of mobile devices.
Read MoreTime Spent With Media By Medium [CHART]
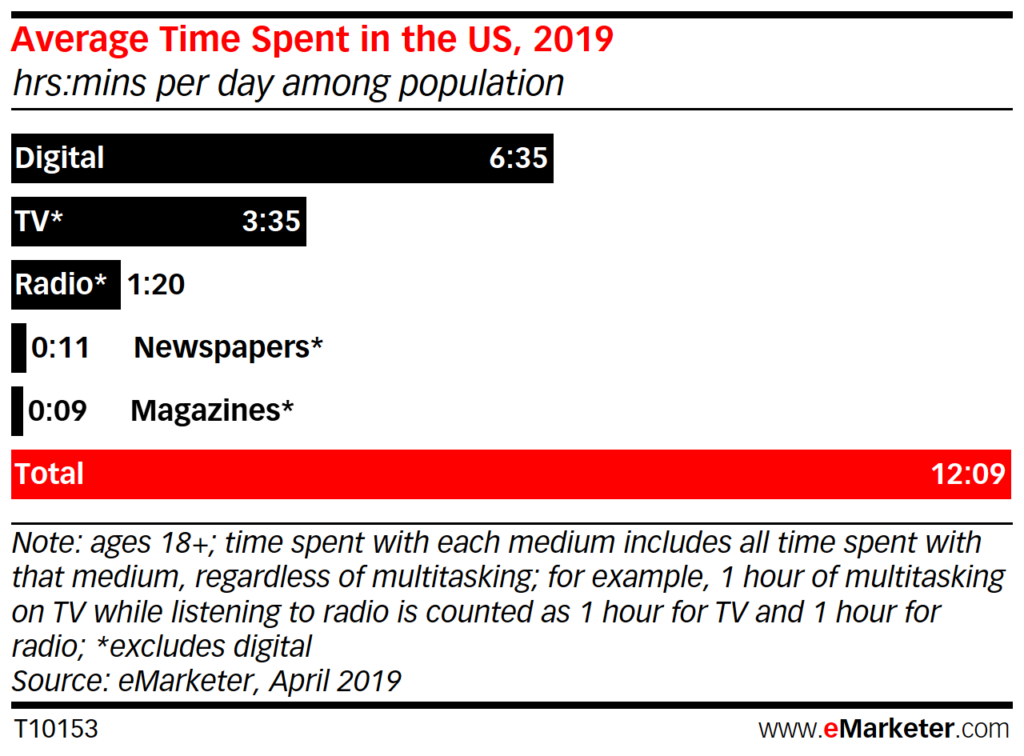
Total time spent with media has stalled in the US, with declines in time spent with TV and other traditional media being offset by increases in time spent with digital media.
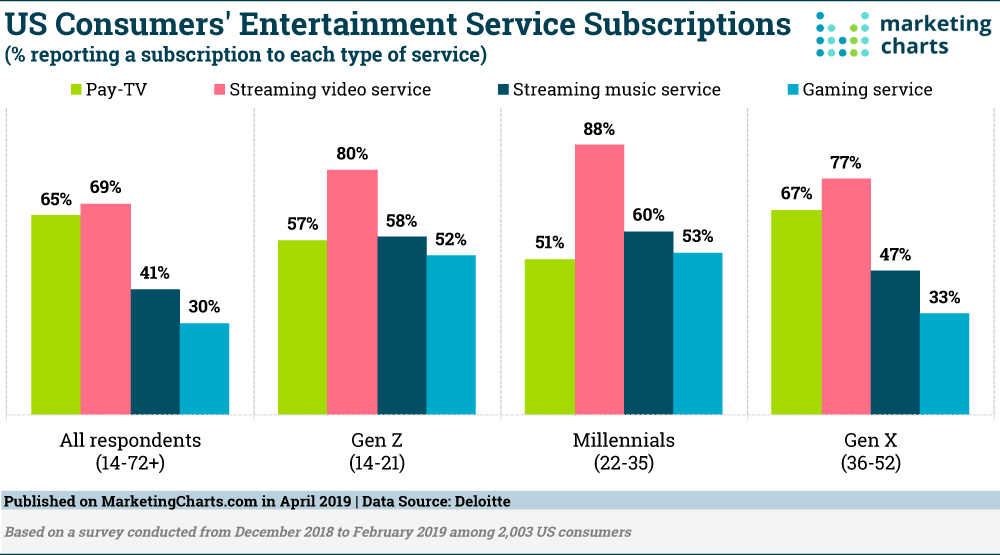
Read MoreEntertainment Subscriptions By Generation [CHART]
The growth of subscription video-on-demand services has been well documented but it looks like a new milestone is in the works. Deloitte’s annual Digital Media Trends survey suggests that more consumers now subscribe to a streaming video service than to traditional TV.
Read More